
Hammersmith Bridge
Where did 25,000 vehicles go?

Paris, 15th April 2019, 6:43pm.
Inside the ancient cathedral all is quiet. Afternoon light filters through the stained glass.
A fire alarm pierces the silence.
Within minutes, flames tear through the oak roof. Eight centuries of timber explode into an inferno visible across the city. Parisians gather on the Seine’s banks as the spire collapses through the nave in a cascade of embers.
Hours later, the French President stands before the ruin: “Cette cathédrale, nous la rebâtirons.”
This cathedral, we will rebuild it.
On 8th December 2024, five years and seven months after the fire, Notre-Dame reopens, its spire restored, the rose windows gleaming once again.

London, 10th April 2019, 3:47pm.
Five days earlier, it’s a bright spring afternoon in west London.
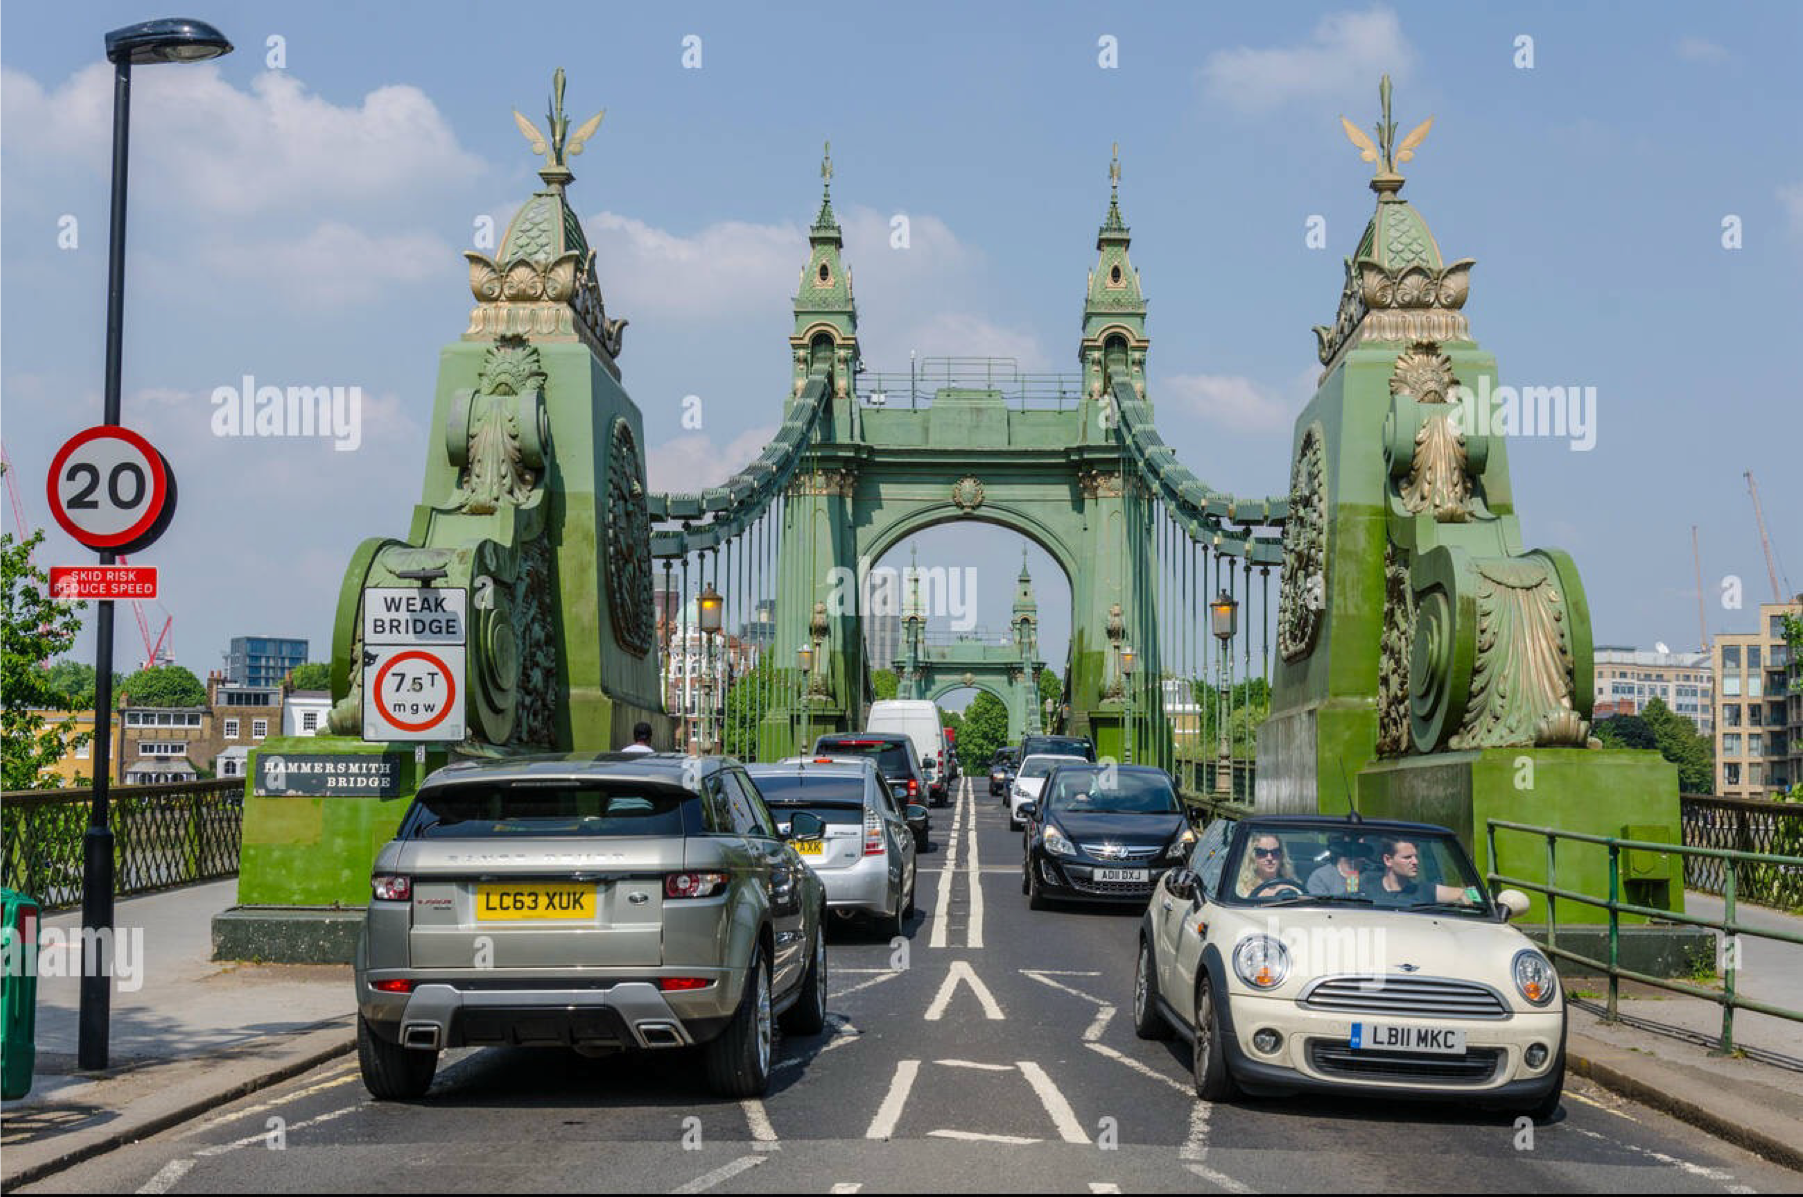
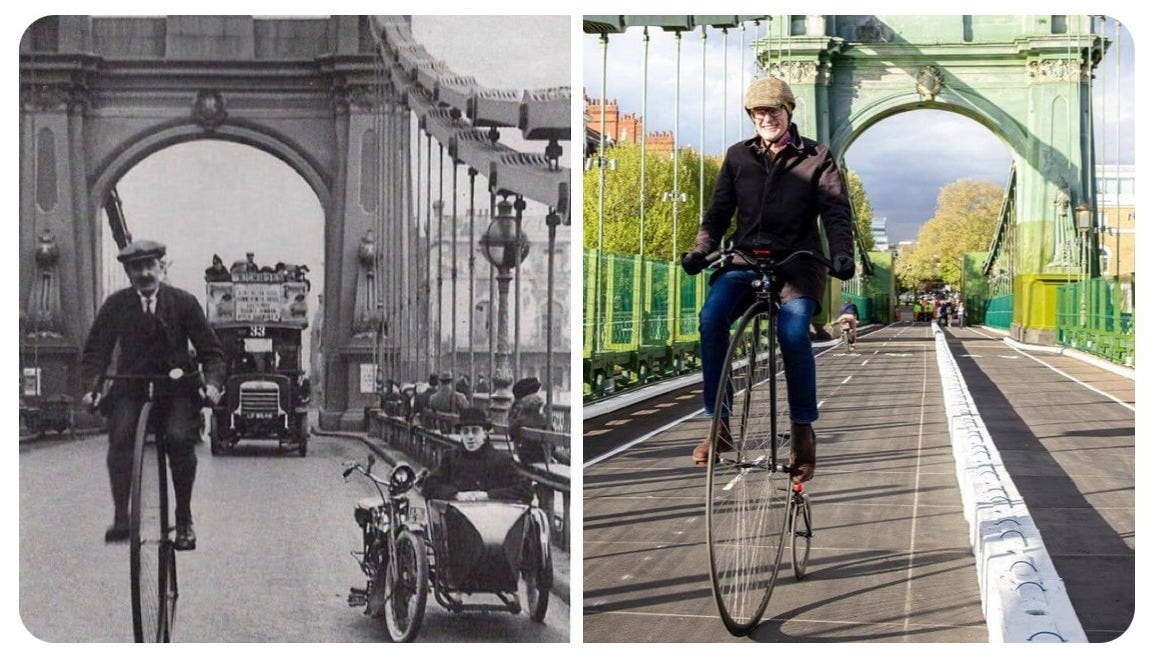
On Hammersmith Bridge, traffic inches forward, suffocated by congestion. Above, the suspension chains creak under the weight of queuing cars. Cyclists weave between wing mirrors. Beneath the footpaths, invisible cracks spread deeper into the 132-year-old pedestals.
Engineers monitoring the structure see the warning signs of imminent collapse. The decision is taken: close the bridge to motor traffic immediately.
Barriers go up. The traffic melts away.
Six years later, Hammersmith Bridge remains closed to vehicles. The solution proposed by local authorities costs £250m and has no funding.

One might reasonably object that comparing Notre-Dame to Hammersmith Bridge is unfair. A Gothic cathedral and a Victorian suspension bridge are worlds apart.
Fair enough. Instead, consider this comparison: Hammersmith Bridge itself.
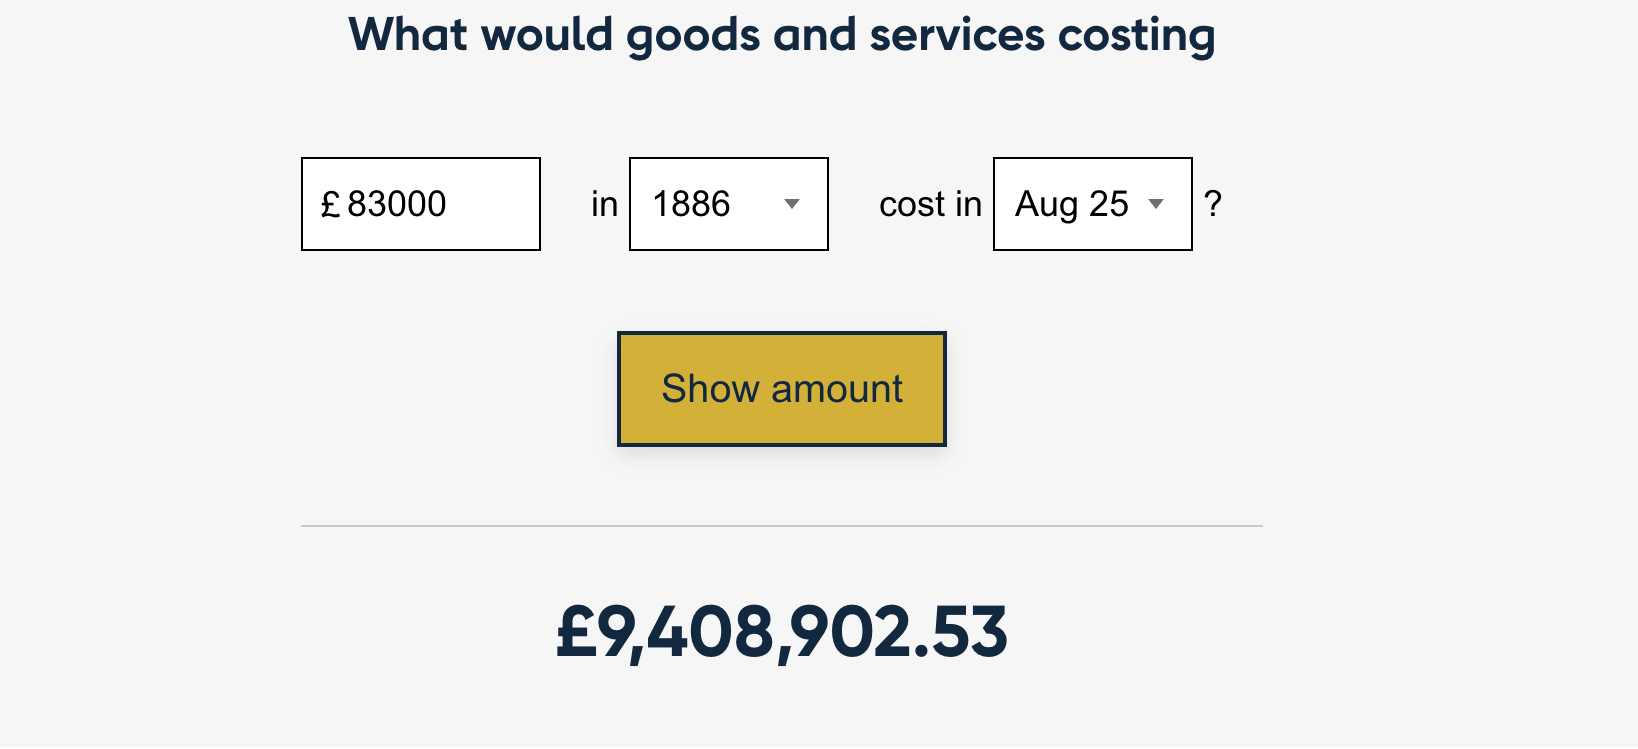
In 1882, a boat struck Hammersmith Bridge causing damage that revealed five decades of deterioration. Parliament authorised a replacement in 1883 and provided for a temporary crossing. Four years later, the Prince of Wales opened a new bridge designed by Bazalgette (of London sewer fame). Cost: £83,000 (£9.5m today).1
In 2019, ultrasound revealed dangerous micro-fractures in Hammersmith Bridge’s structure. The bridge was immediately closed with no temporary alternative provided. Six years later, the bridge is still closed to traffic (but stabilised). Cost to date: £48m, with full restoration estimated at £250m. Long-term solution: none.
Our Victorian forebears rebuilt their broken bridge faster than we’ve failed to find a solution for ours.
Hammersmith Bridge isn’t just a local transport problem, it’s symptomatic of Britain’s broader state crisis.
This is happening in central London. Not in a rural “backwater”, not in a “left behind” urban centre, but in one of the wealthiest communities in Britain, on a major transport artery. If Britain cannot fix Hammersmith Bridge, what is failing in places that nobody is watching?
This essay examines two questions.
First: how did Britain reach a point where we cannot fix a bridge?
Second: given that reality, what should we actually do about Hammersmith Bridge?
The first answer reveals a state crisis: every actor can block decisions; none can compel action.
The second is more surprising.
When the bridge closed, about 25,000 vehicles crossed it daily and TfL predicted a severe economic impact.
Six years later, 9,000 of those journeys have vanished - not diverted to other crossings, but simply evaporated. Yet the local economy has adapted, air quality has improved, and overall traffic congestion has lessened.
This counterintuitive outcome begs the question: are we actually solving the right problem?
The “obvious” £250m solution may be addressing the wrong issue. The best solution may cost far less, involve no cars, and turn paralysis into opportunity.
Part 1: State Failure in Microcosm
The history of Hammersmith Bridge
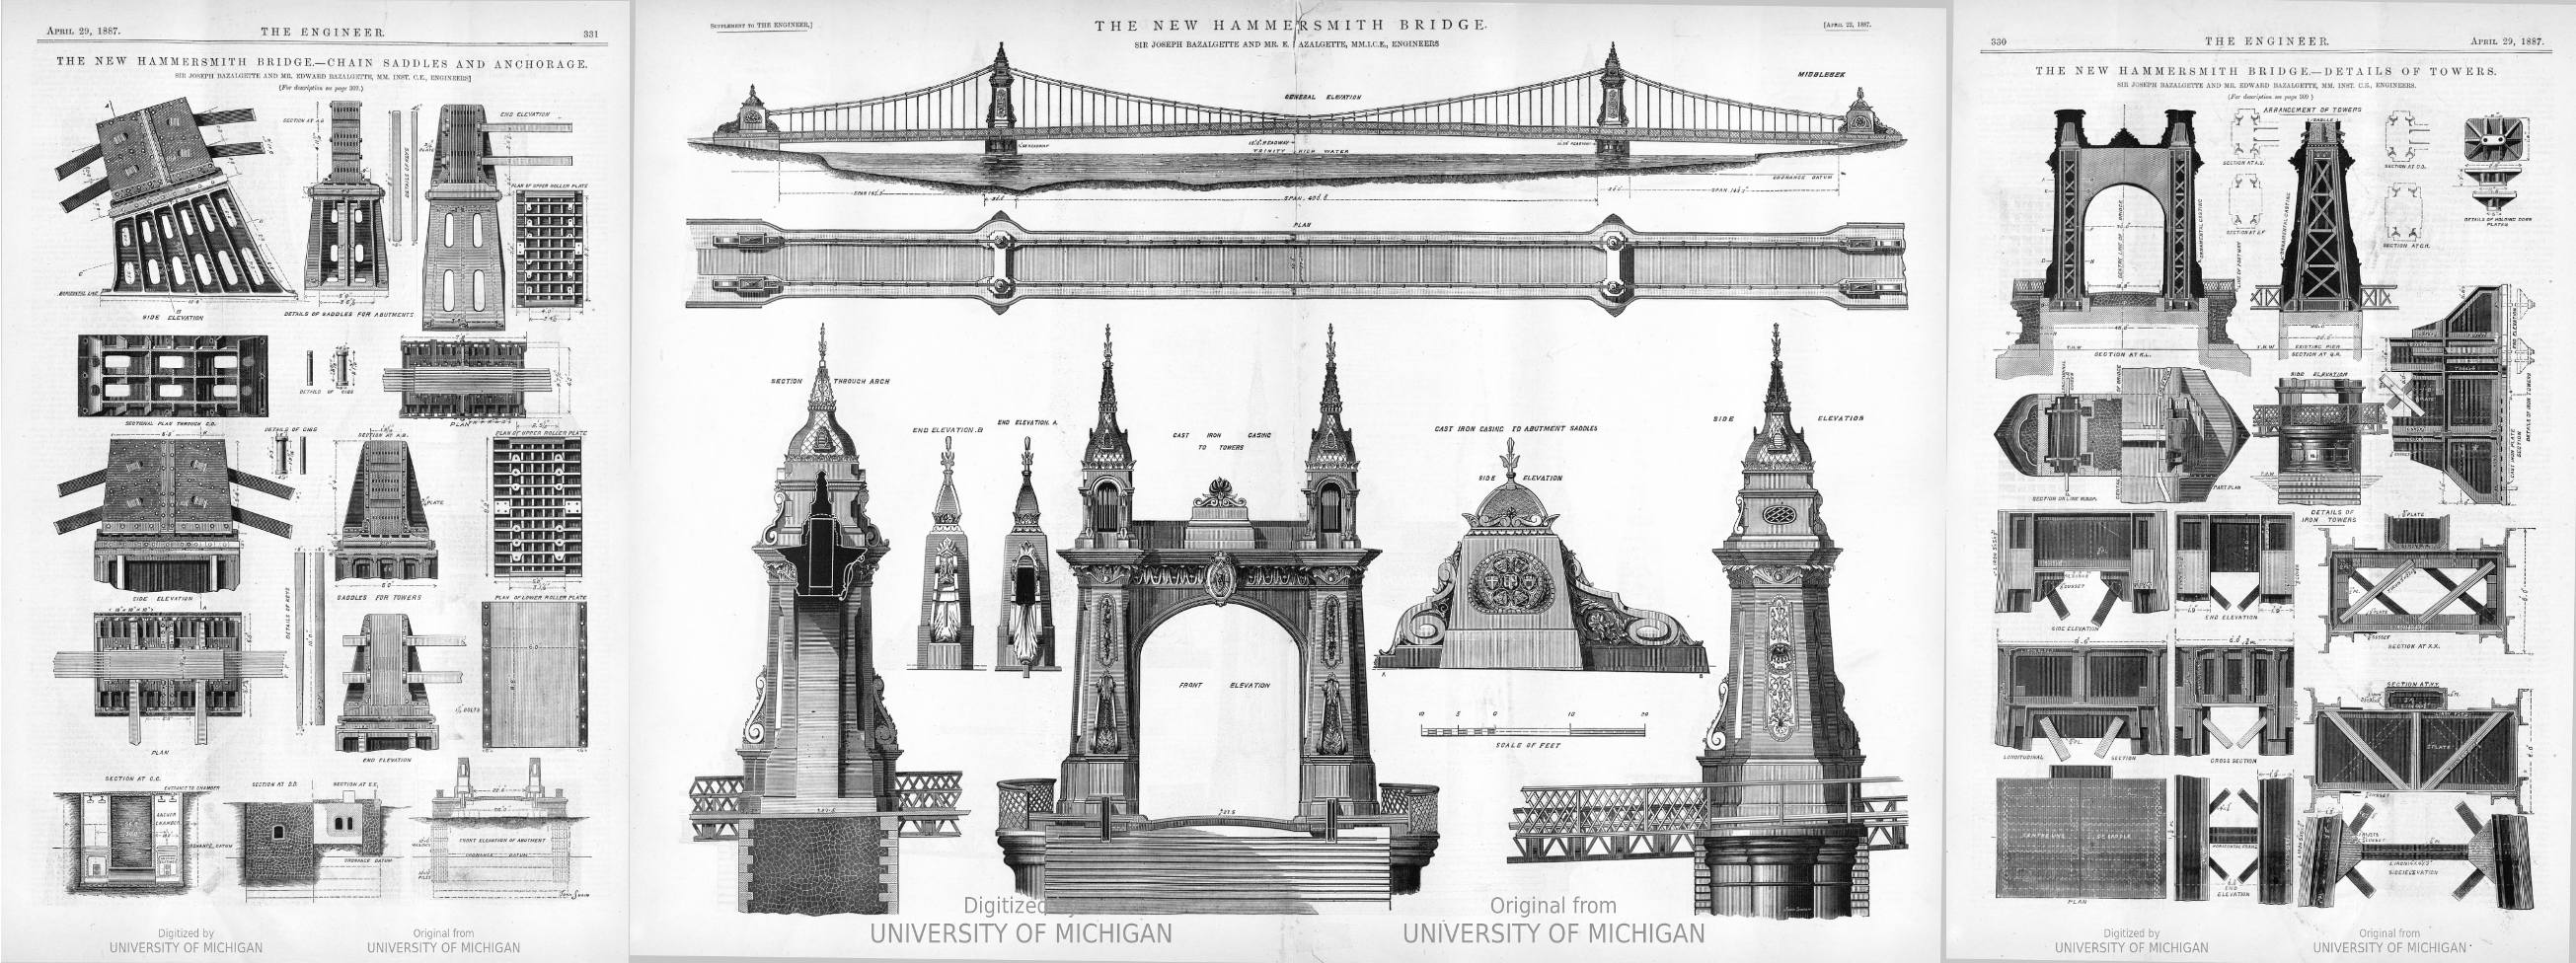
Hammersmith Bridge is a testament to Victorian engineering prowess. The present-day bridge is Bazalgette’s 1887 design: a wrought-iron suspension structure with ornate decorative features and coated in deep green paint that blends into the willow-lined bank.
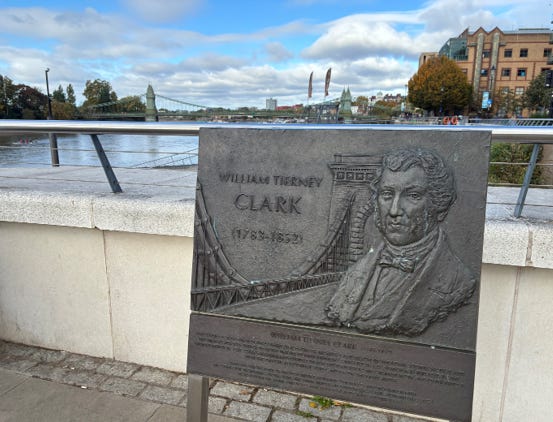
It replaced an earlier bridge constructed in 1827 by local engineer William Tierney Clark. That first bridge cost £80,000 (approximately £8.9m today), was funded by private investors, and operated as a private toll bridge by the Hammersmith Bridge Company.2 Unusually amongst London toll bridges, it turned a profit. In 1880, it was purchased by the Metropolitan Board of Works and made toll-free.3
Clark’s designs at Hammersmith and Marlow so impressed a visiting Hungarian aristocrat that he was later commissioned to build a sister bridge in Budapest, the Széchenyi Chain Bridge over the Danube, which remains a national symbol today.4
Fifty years later, in 1882, the aforementioned boat collision and concerns about weight capacity on Boat Race days led Parliament to authorise a replacement.5 A temporary crossing structure was installed and just four years later, on 11th June 1887, Bazalgette’s bridge was opened at the cost of £83,000 (approximately £9.5m today).6
Why was Hammersmith Bridge closed?
For over 125 years, the bridge received minimal maintenance.7 This is despite it being bombed three times: by the IRA in 1939, the Provisional IRA in 1996, and the Real IRA in 2000.8 9
Only in 2014 was a comprehensive structural review first commissioned.10
The findings were alarming: decades of unchecked corrosion had created micro-fractures throughout the suspension structure, and the Victorian bearings that allow the bridge to flex with temperature had seized solid.
In April 2019, engineers discovered that the micro-fractures had widened enough to close the bridge to vehicles, though pedestrians and cyclists could still cross. Then in August 2020’s heatwave, sensors detected rapid crack expansion. The council’s senior engineer allegedly gave the council leader just 30 seconds to make the critical decision.11
Cast iron is unforgivingly brittle; it doesn’t bend, it shatters. With the potential for catastrophic collapse into the Thames, the bridge was completely closed, halting both pedestrian and river traffic beneath.12

Did the review and precautionary measures save lives?
Consider Genoa’s Morandi Bridge, a 210-metre section collapsed in August 2018, killing 43 people. The operator had warned in 2011 that collapse within 10 years was possible, yet adequate action was never taken.
Compare too Dresden’s Carola Bridge, a 100-metre section collapsed in September 2024 just minutes after the last tram crossed. The cause was hidden stress corrosion cracking that had existed since construction in 1971.
What repair work has been completed to date?
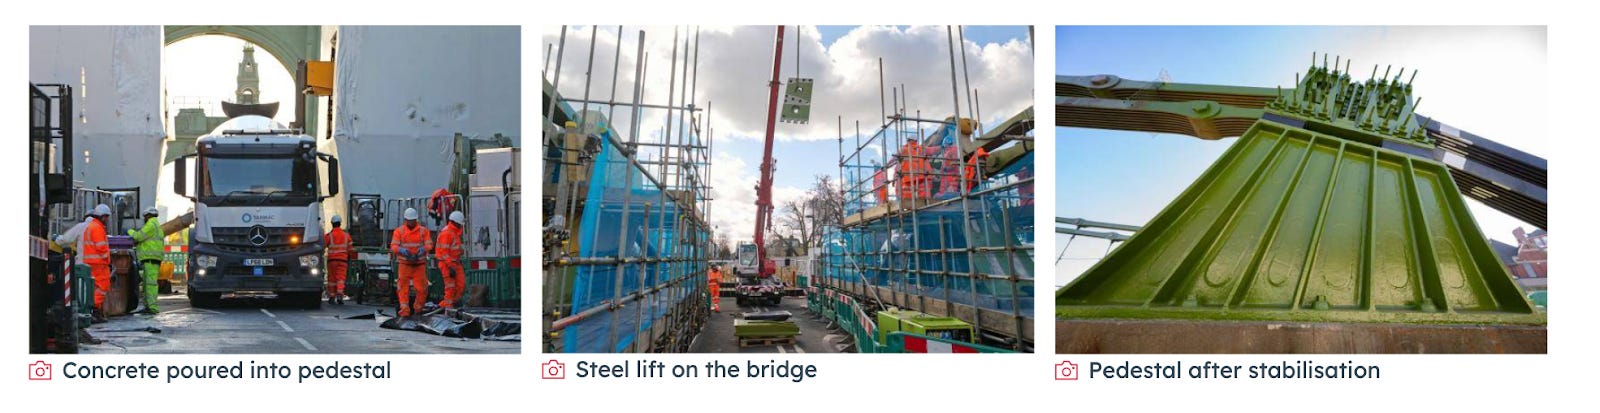
In 2021, stabilisation work was undertaken and the bridge’s side walkways were made accessible to pedestrians and cyclists.13 Engineers innovatively filled the cast iron pedestals with fibre-reinforced concrete, installed steel support frames, replaced the Victorian bearings with modern rubber ones, and wrapped the chains in foil with air conditioning to keep them cool during heatwaves.
What can the stabilised bridge carry?
The local council initially claimed the stabilised restriction limited vehicles to 1 tonne (equivalent to a Fiat 500). After a third FOI request and internal review, the local council acknowledged the maximum allowable mass was 3 tonnes (a Volkswagen Transporter).14 The bridge cannot support regular buses (12-18 tonnes) or normal traffic, but could theoretically support one lightweight vehicle. The stabilisation has secured the structure, but not restored its function.
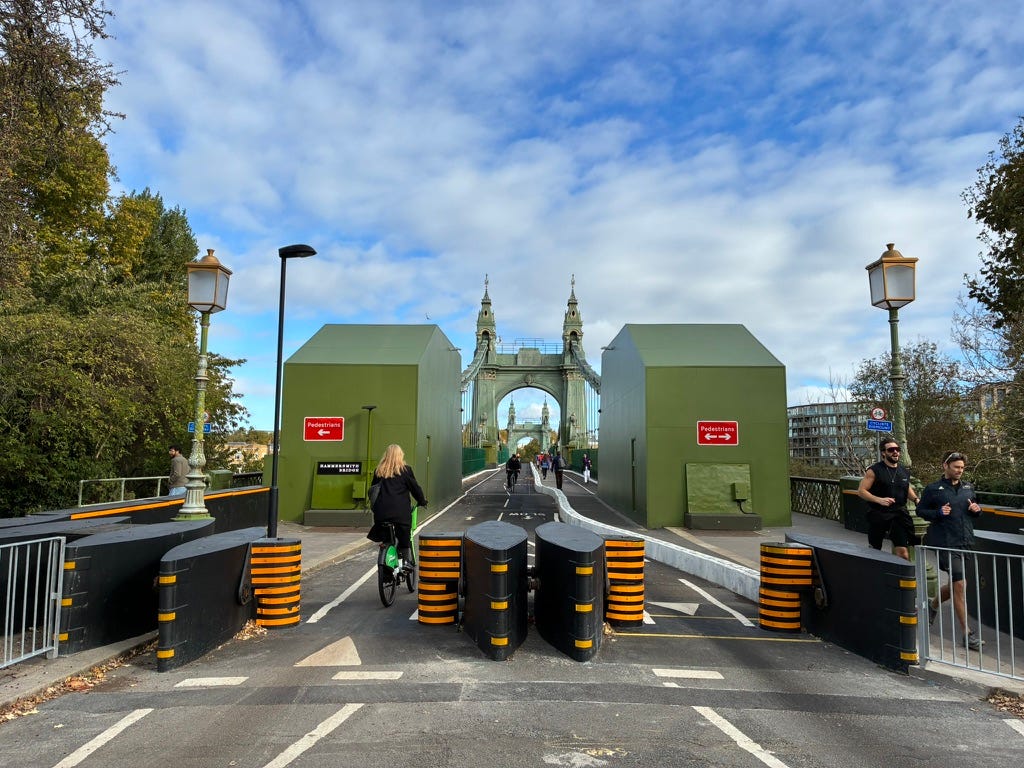
In April 2025, with stabilisation achieved, the main carriageway was reopened to cyclists and pedestrians, exactly six years after the initial closure, but remains closed to all vehicle traffic including buses and cars.

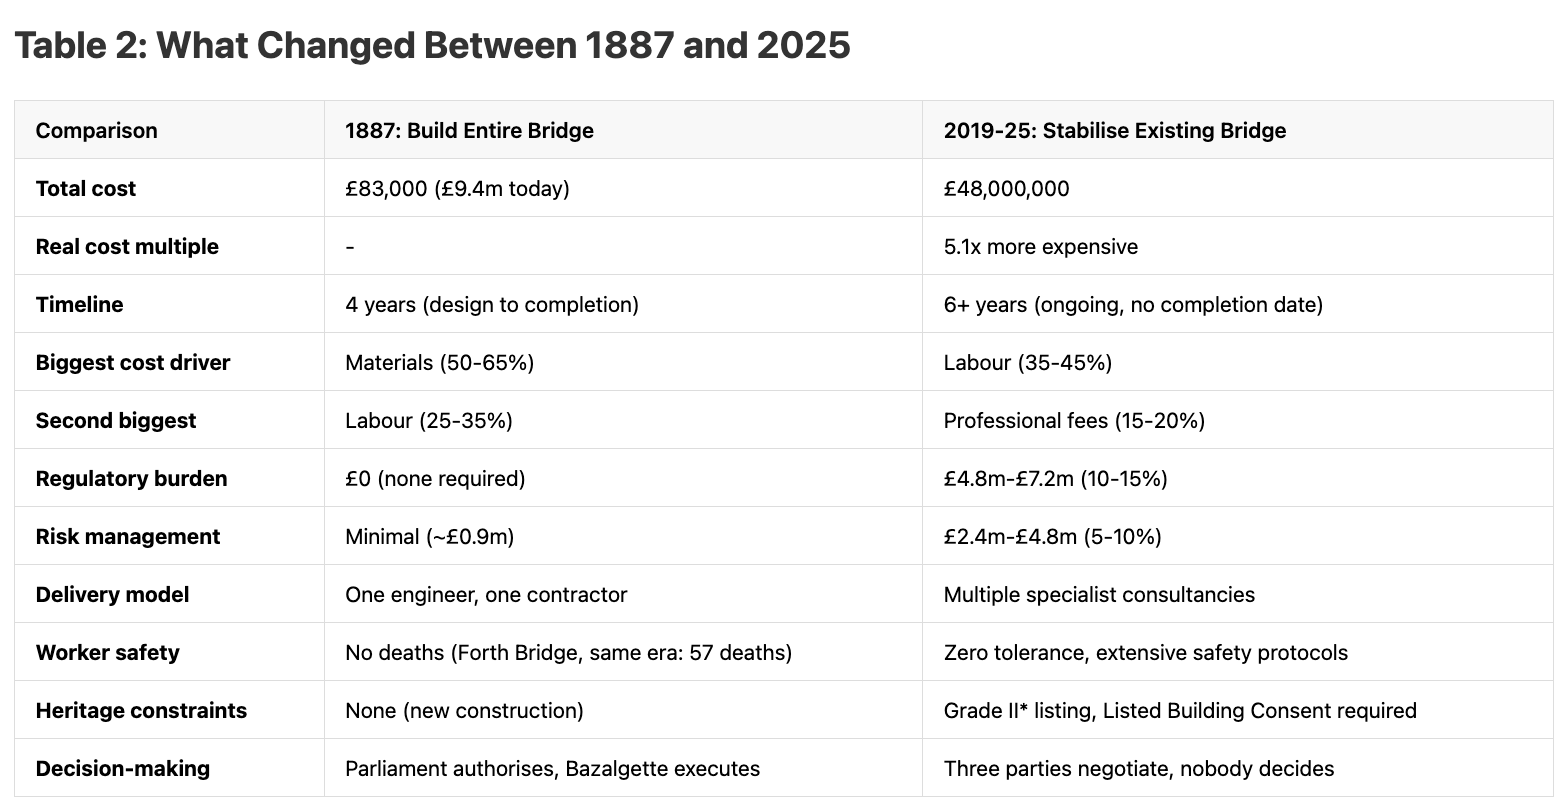
Why was the Victorian bridge built cheaper and faster?
The stabilisation works to date have cost £48m, five times more than the original construction costs for the entire bridge - why is that?
The explanation lies in a fundamental shift in cost structure.
The 1887 bridge (£83,000, or £9.4m today) was dominated by material costs (perhaps 60%), with minimal professional fees and zero regulatory costs.15
The 2019-25 stabilisation (£48m cost) inverts this cost structure: labour comprises perhaps 40%, professional fees have tripled to perhaps 18%, and regulatory compliance (a category that didn’t exist in Victorian times) consumes perhaps 12%.16
No itemised accounts exist for either project, but these estimates are based on comparative studies of similar projects (methodology in footnotes).
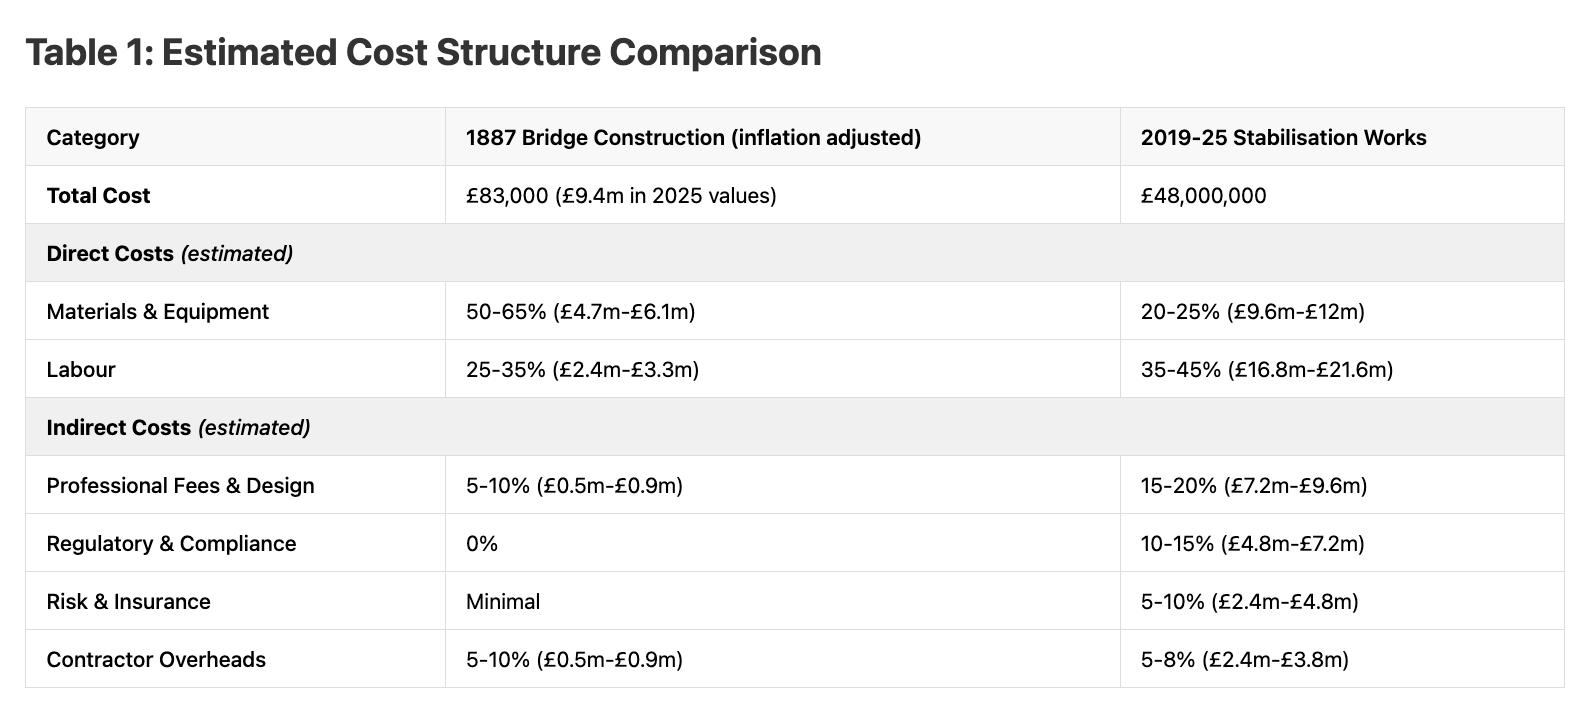
There has been a profound increase in the cost of British infrastructure. This cost inflation reflects genuine progress, but of a specific kind.
The Victorians built with brutal efficiency: workers died on their projects (accepted as the cost of doing business), heritage protection was non-existent, and accountability was staked on just one engineer’s reputation.
We have replaced this with a system that is better, but also exponentially more expensive: zero-tolerance safety protocols, Grade II listing requirements, extensive insurance and oversight structures. Regulatory compliance (a category that didn’t exist in 1887) now consumes perhaps 12% of the budget.
The Victorians deployed one engineer and one contractor. The modern stabilisation required six major organisations plus multiple specialist consultancies, quangos and charities. Each improvement is defensible on its own merits. Taken together, however, they create paralysis: costs multiply, timelines extend, and every stakeholder gains effective veto power.
These aren’t individual failures but rather a systemic accumulation of red tape that paralyses progress.
What is the proposed long-term solution?
The £250m restoration
The first challenging technical problem is solved: the bridge is now stabilised, albeit at significant expense.
But who will fund the complete restoration to return the bridge to its full operational capacity?
In April 2023, the local council submitted a business case to the DfT for full restoration.
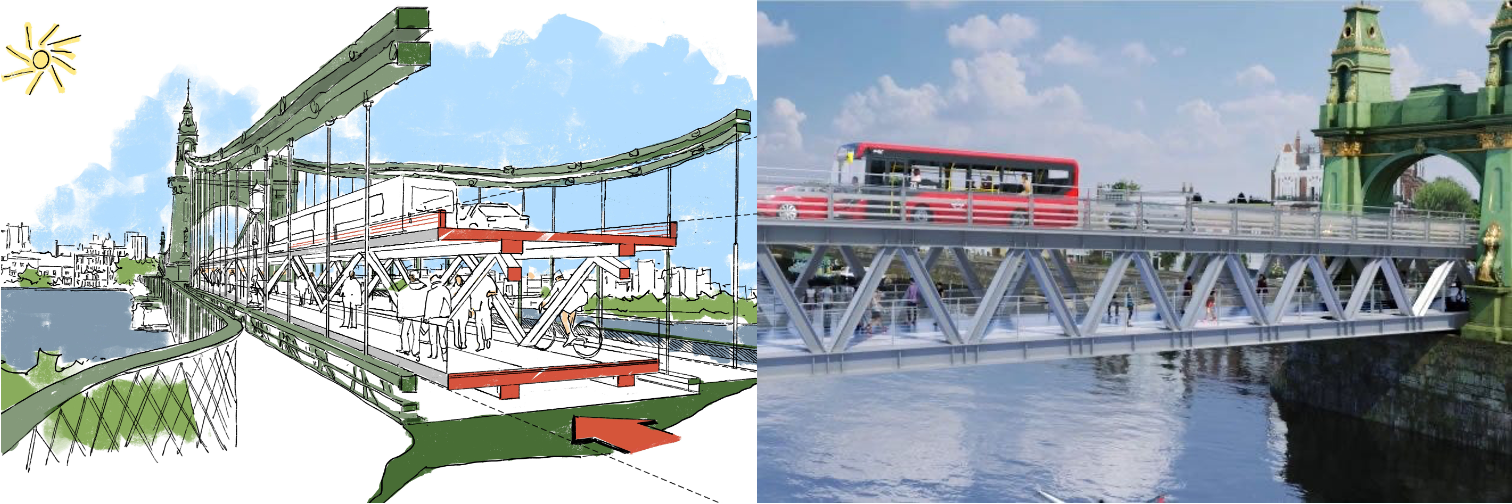
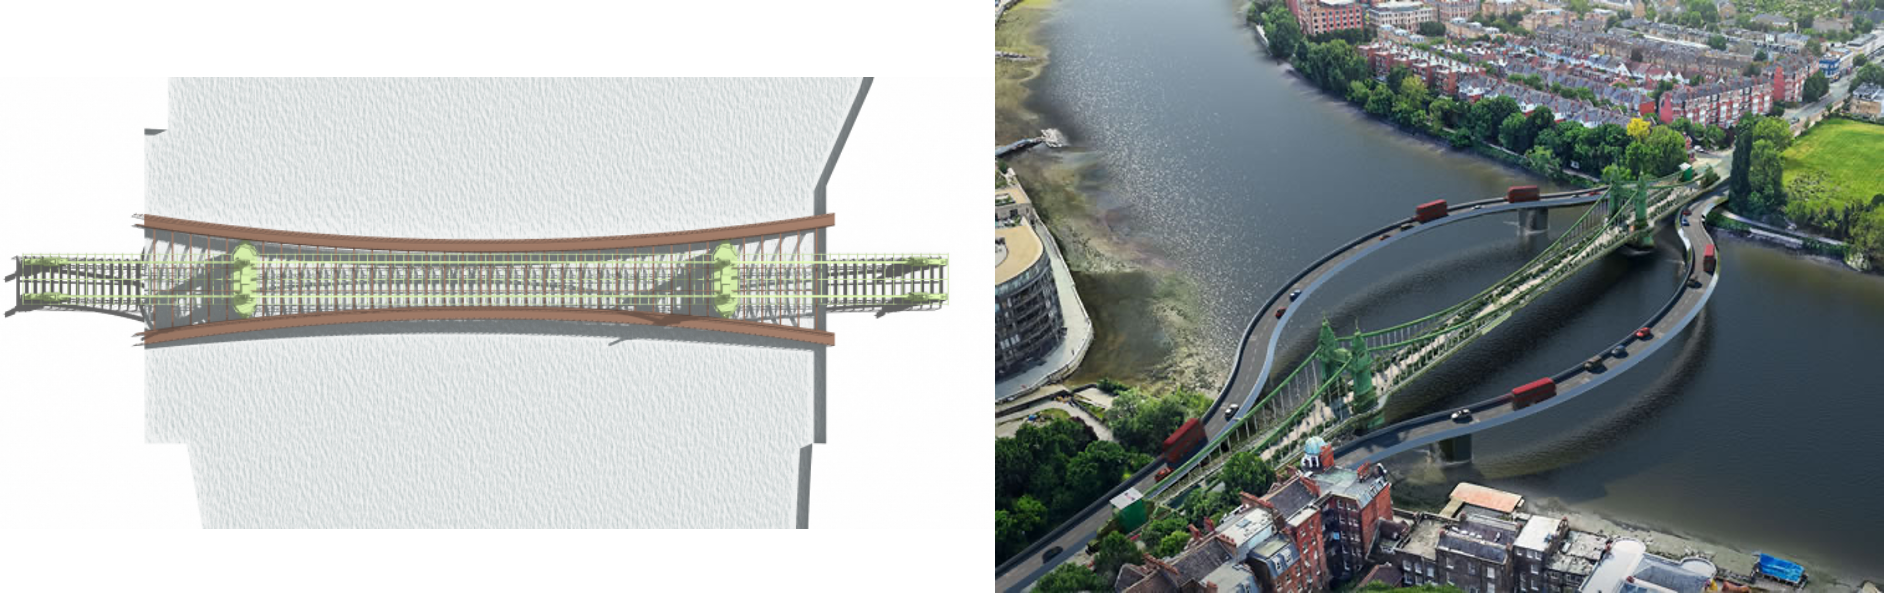
That proposed solution is a double-decker system designed by Foster & Partners: vehicles on top, pedestrians in an enclosed tunnel underneath, walking through a dim passage while traffic roars above their heads.
The cost: £250m (and rising with inflation). The timeline: 10 years from approval, meaning 16+ years total since closure.
There is an irony. The entire justification for this solution is heritage preservation, yet this solution will encase the listed Victorian structure in a visual eyesore, forcing pedestrians into a claustrophobic tunnel, ruining the very heritage it claims to preserve.
Who will pay the bill?
Here’s where Britain’s infrastructure dysfunction becomes concrete.
Three players are each committed to funding one-third of any restoration:17
London Borough of Hammersmith and Fulham (LBHF): Local council and bridge owner. £80m total reserves.
Transport for London (TfL): Transport authority strategically responsible for river crossings but financially crippled despite government bailouts post-Covid. Faces a backlog of 100+ critical infrastructure repairs, with Hammersmith Bridge far down the priority list.
Department for Transport (DfT): National government department, normally provides 85% funding for strategic bridge repairs but has slashed commitment to just 33% for Hammersmith.
Since LBHF submitted their restoration plan in April 2023, the DfT has sat on this business case.
Why have they delayed? It is very likely that the £250m restoration will fail the Treasury’s value-for-money tests, but nobody is yet willing to admit that publicly.
The benefits are modest: reconnecting two wealthy areas across a short river crossing with multiple alternatives nearby. The costs are astronomical: £250m for bespoke heritage restoration, taking 10+ years, with each party exposed to inflation risk.
For context, TfL only spent £42m in 10 years between 2010-2021 for the maintenance of all Thames river crossings.
Some would call Hammersmith Bridge a state capacity failure. But let’s be precise about what has actually failed.
Not engineering ability: British engineers remain world-class, and the stabilisation work completed so far is evidence of that. Not resources: the proposed cost is a rounding error in national budget terms.
What has failed is our political capacity: the ability to make decisions, assign responsibility, and accept trade-offs.
We’ve created a planning system in which every actor can block and add cost but where none can decide, where doing nothing is the safest choice.
Are there any other proposed solutions?
In the vacuum left by years of inaction, a cottage industry of alternative proposals has emerged.
Baynes & Mitchell proposed a £110m interwoven structure. Sybarite’s inventive mirror-polished steel “ribbon” was dismissed as “another eccentric press stunt” by the council. Anthony Carlile Architects mocked up a temporary barge bridge. The Manser Practice held an internal competition yielding conceptual designs. The Richmond MP proposed licensed rickshaws.18 LBHF council have “not ruled out” funding restoration via a resident-exempt vehicle toll (though this appears unviable on basic calculations),19 whilst the DfT briefly considered permanent closure as a monument.
Even friends regularly offer enlightening new suggestions: inhabited bridges (funded through commercial and residential leases); a version of Wuppertal’s Schwebebahn (a public transport monorail operating since 1897); or London’s failed Garden Bridge.20
The problem is not ingenuity. It is a system that blocks any decision-making.
Hammersmith Bridge with Chinese characteristics?
Here is a more facetious proposal: award the contract to a Chinese state-owned operator.
Why China? Well, China’s bridge engineering operates at a scale that is difficult for those of us in a de-industrialised nation to comprehend.
At least 9 Chinese bridges have been built that would span the English Channel.21
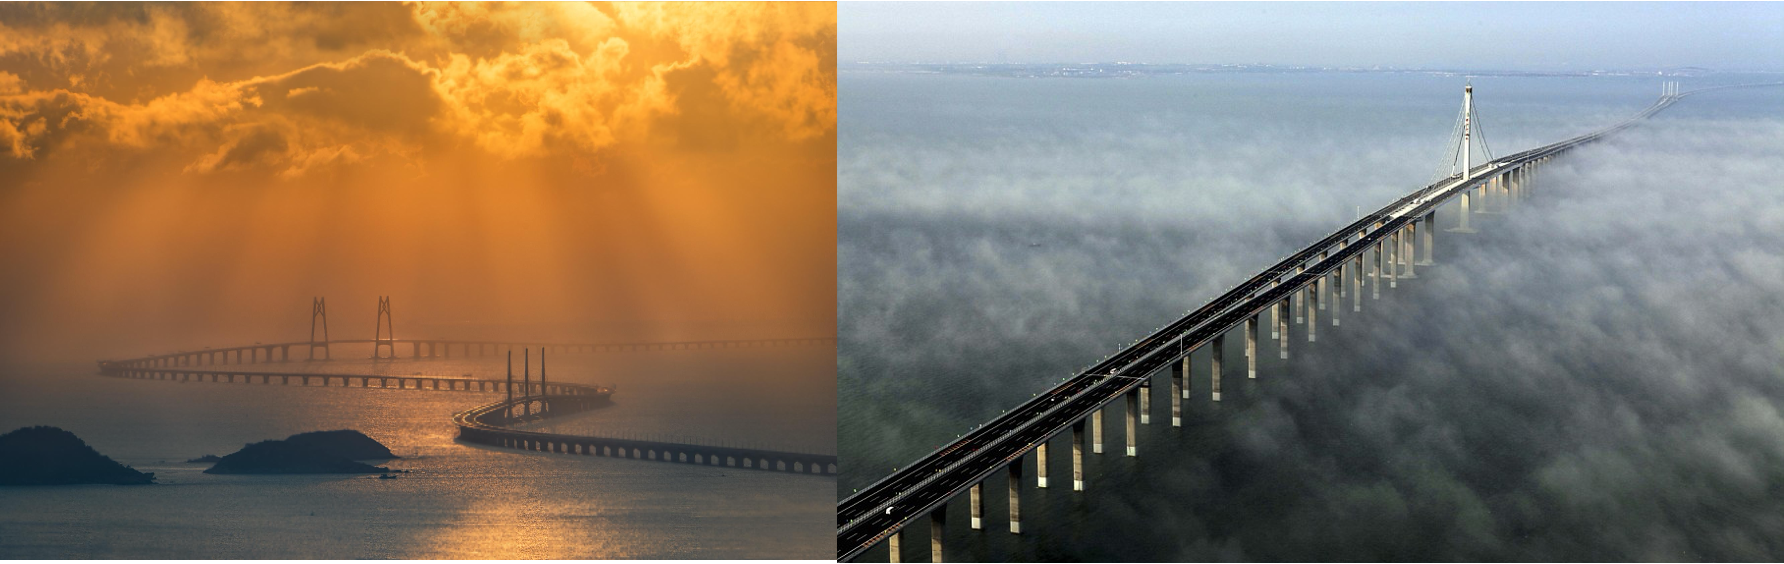
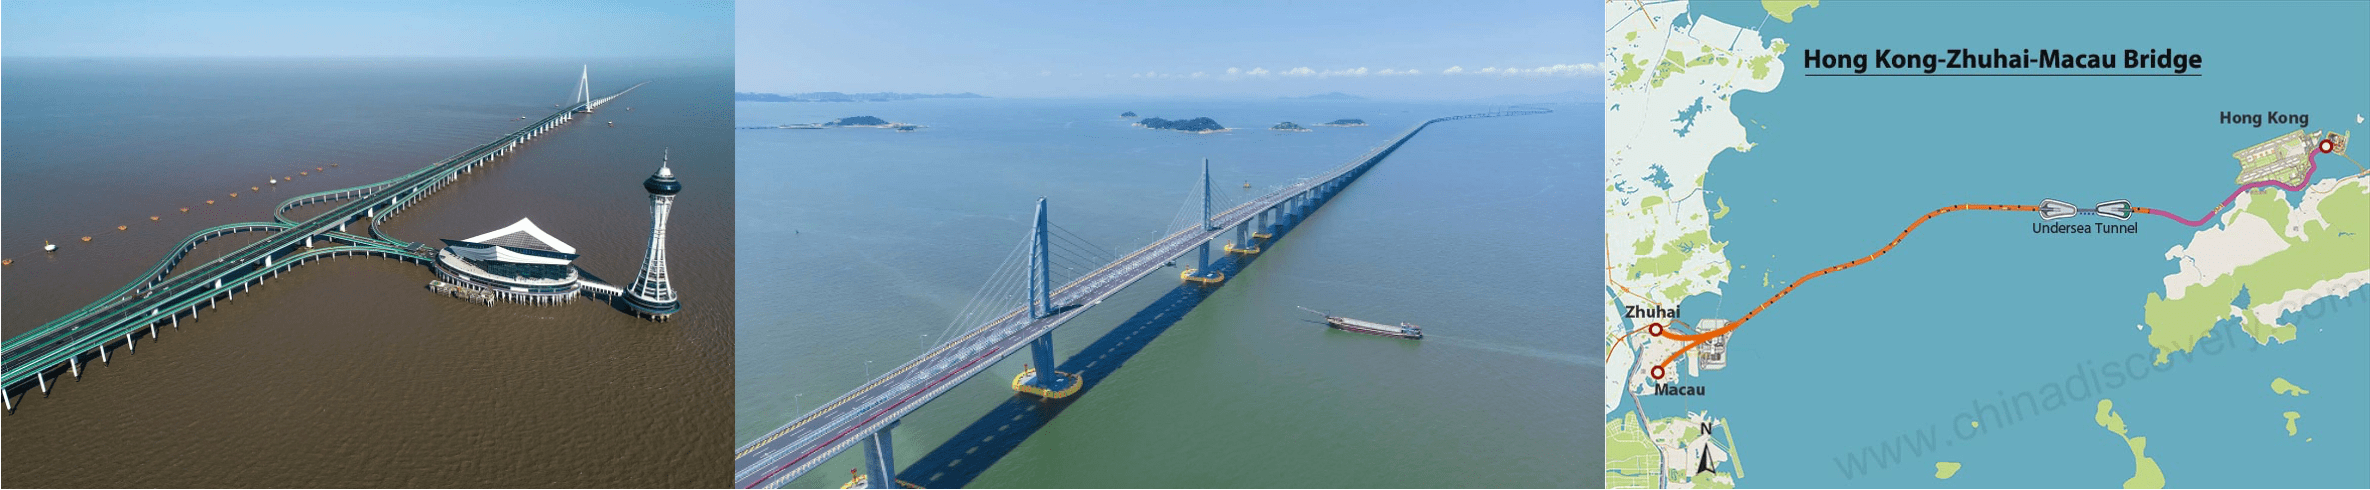
For instance, the 55km 6-lane trans-oceanic Hong Kong-Zhuhai-Macau Bridge features 23km of elevated sections, a 6.7km immersed vehicle tunnel at 45 metres below sea level, and four artificial islands, completed in just 9 years of construction.22
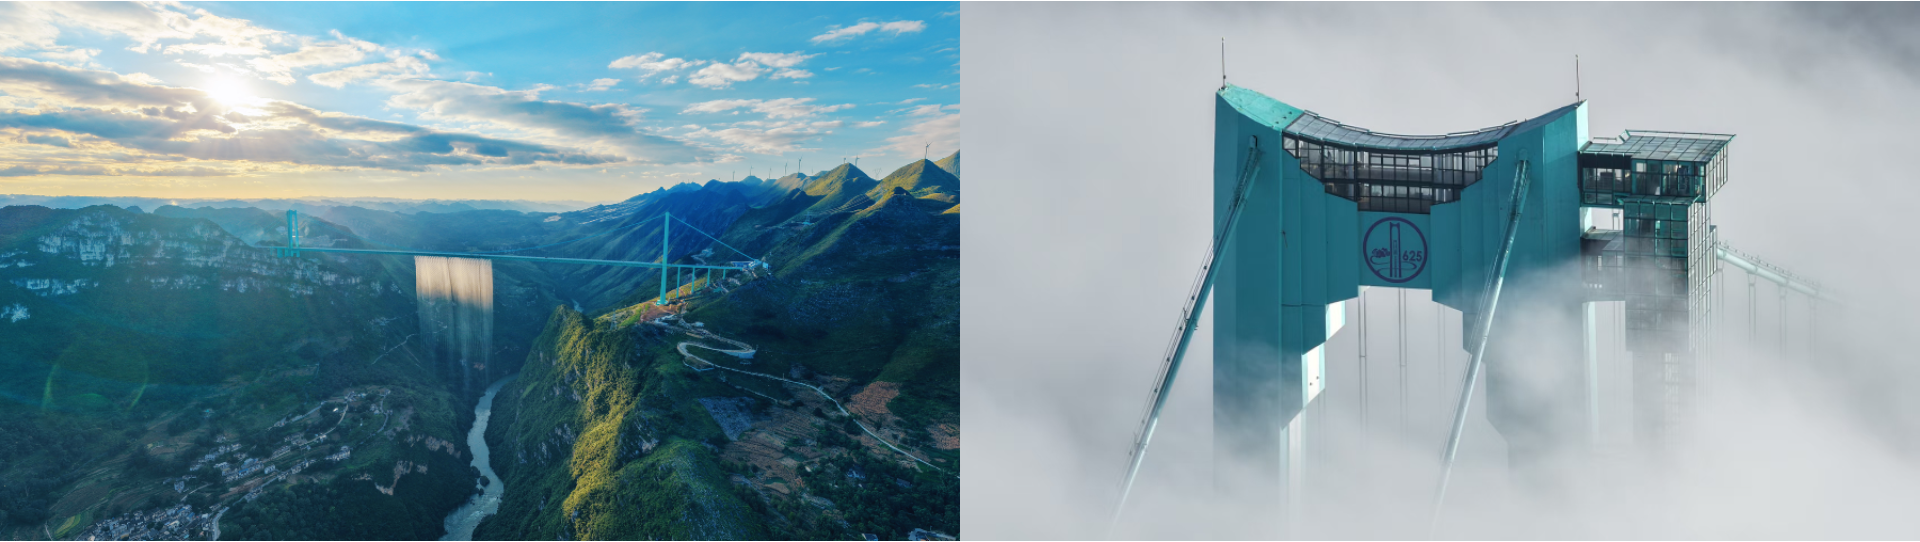
The Huajiang Grand Canyon Bridge, completed in September 2025, is furnished with a “cafe in the clouds” and an artificial waterfall. It spans 2,890m at a height of 625m above the Beipan River and was built in less than 4 years for ~£220m (2.1 billion yuan), less than the proposed restoration of Hammersmith Bridge.23
In comparison t these mega-projects, Hammersmith Bridge seems rather modest.
But Britain is not China.
In terms of state capacity, China’s sustained construction programme generates continuous learning and accumulated expertise; Britain builds episodically and as much as half of its wage premium is due to costs rising without corresponding productivity gains.24
But in terms of values: we demand zero construction deaths, fair wages, and democratic accountability. China’s infrastructure achievements are staggering, but they’re inseparable from its authoritarian system: bridges built without parliamentary debate, villages demolished, environmental concerns overridden, labour protections minimal. The costs mask 8-15 worker deaths per project and £1-8 daily wages and lower build quality.25
Britain’s paralysis isn’t simply incompetence, it’s the cost of worker safety, political accountability and heritage protection.
The question is not “why can’t we build like China?” but “how do we deliver infrastructure within our political and value system?”
Should we simply demolish and rebuild the bridge?
£250m for a restoration is an extraordinary sum of money, so how about we just build a new bridge altogether?
At the January 2025 Taskforce meeting, the DfT proposed a demolition and rebuild. This proposal was rejected as legally impossible given the structure’s Grade II listing. But the heritage protection framework is policy, not immutable law. The Grade II listing was only awarded in 2008.
What would it cost simply to demolish Hammersmith Bridge and build a modern replacement?
The brief (assuming permission were granted) would be demolish the existing structure and build a functional and safe 210-metre Thames bridge crossing at Hammersmith, carrying two vehicle lanes plus pedestrians and cyclists.
Answer: £150-225m. A complete replacement would most likely be a beam bridge and require 4-6 years from project start to completion. Overall contingency 20%. The full methodology for my estimate can be found in the footnotes.26
There are two caveats to this estimate:
First, I’m not an engineer or architect. This estimate can in no way replace a detailed feasibility study, it is a back-of-the-envelope guess that offers a rough benchmark.
Second, this estimate underplays the vast range of uncertainty in UK infrastructure delivery. Although there is limited ambiguity in the engineering of the bridge itself, the current state of infrastructure construction in Britain means that the final price tag is highly uncertain.
Just compare other recent projects for Thames river crossings. The Rotherhithe Bridge saw costs triple from £100m to £463m before cancellation. The Lower Thames Crossing has spent over £300m on planning alone - more than Norway spent building the world’s longest road tunnel (the Laerdal Tunnel). The Thames Tideway Tunnel escalated from £1.7bn estimate in 2004 to £4.5bn by completion in 2025. The Silvertown Tunnel cost £2.2bn for a straightforward 1.4km crossing.27 Or consider High Speed 2 (HS2): £40.5bn spent to date (as of April 2025), having achieved very few of its stated aims. Final cost estimated at over £100bn in today’s money.28 That includes the £100m bat tunnel and the £100m HS2 bridge to nowhere.29
Even if the costs of a re-build were acceptable to the Treasury (they’re not) and the legal barriers were removed (they won’t be), demolition would destroy real value. £48m has already been spent stabilising the bridge and this is not simply sunk cost fallacy. The bridge now functions for cyclists, pedestrians, and motorised vehicles up to 3 tonnes, while retaining heritage significance no rebuild could match.
When projects routinely spend hundreds of millions just obtaining permission, throwing away a stabilised structure becomes hard to justify.
What is the de facto solution?
The bridge has been closed to motor traffic for six years. Primary school children in Barnes cannot remember when cars could cross. What began as an emergency closure has calcified into permanent car-free status through institutional paralysis.
The solution that is unfolding by default is to do nothing.
This has never been formally proposed, yet everyone’s inaction point towards it. Last month, bridge contractors filed a planning application requesting permission to transport Victorian ironwork to Brighton for long-term storage, indicating no prospect of restoration in the foreseeable future.30 After all, it could take years or decades before political change unblocks this system to even enable a rebuild, if ever.
To do nothing would imply that vehicle access does not matter. The bridge isn’t really closed - you can still walk or cycle across. And that’s better, isn’t it? We don’t want cars in cities anyway, right?31
No! A major London transport link has ceased to function, and there are currently no plans to address it. That should not be acceptable in a competently governed society.
We cannot accept this state of affairs.
But first, we must ask the right questions.
Part 2: Asking the Right Questions
When I began researching this piece, my intuition was straightforward: closing a major bridge carrying 25,000 daily vehicles should lead to more traffic on other nearby crossings and less economic activity on either side.
The evidence shows the exact opposite. Today there is less traffic and more economic activity.
How is that possible?
To answer that question, we must understand:
What happened to the traffic?
What are the social and economic impacts of the closure?
Who has been genuinely disadvantaged?
What happened to the traffic?
When the bridge closed in 2019, 25,000 vehicles crossed it each day.
TfL predicted chaos: a July 2019 impact assessment showed 15,000 additional motorised vehicles per day on alternative crossings and estimated “social dis-benefits to exceed £50m per annum.” Local MPs still cite these figures.
But what does the data show six years on?
Today, there is less traffic and congestion on nearby Thames crossings than before the closure.
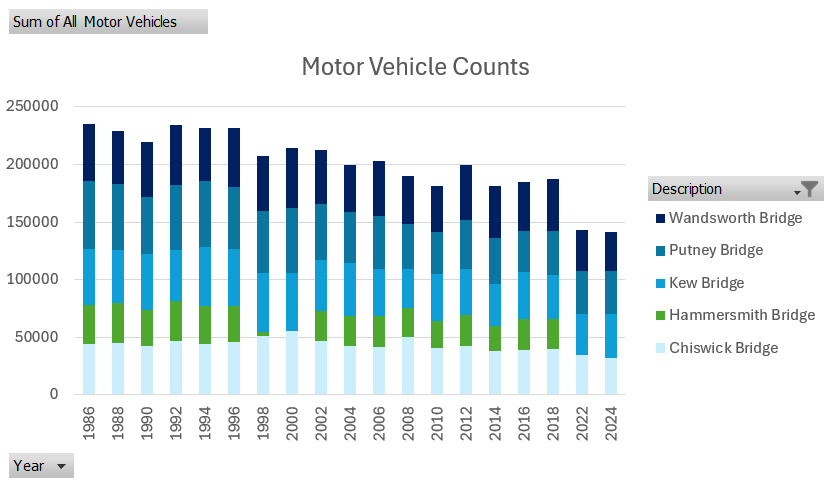
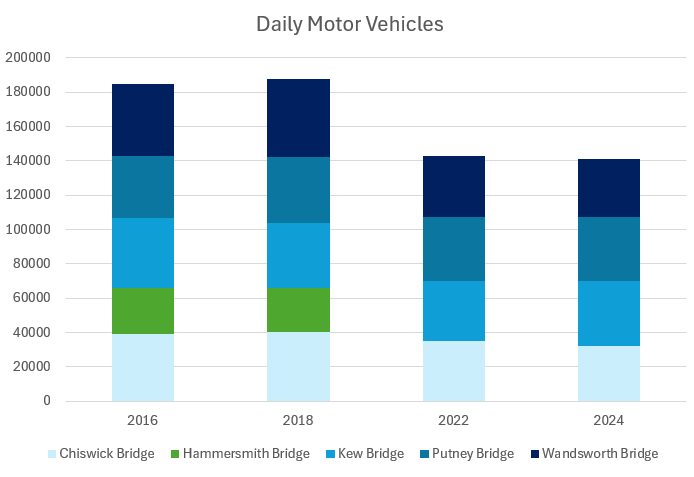
The data shows traffic has reduced in almost all the locations where increases were initially recorded. By 2024, overall motor traffic volumes across the affected region had fallen by around 10% more than in the rest of London (25% overall). Likewise, total traffic counts on neighbouring road bridges are lower than pre-closure (charts above).
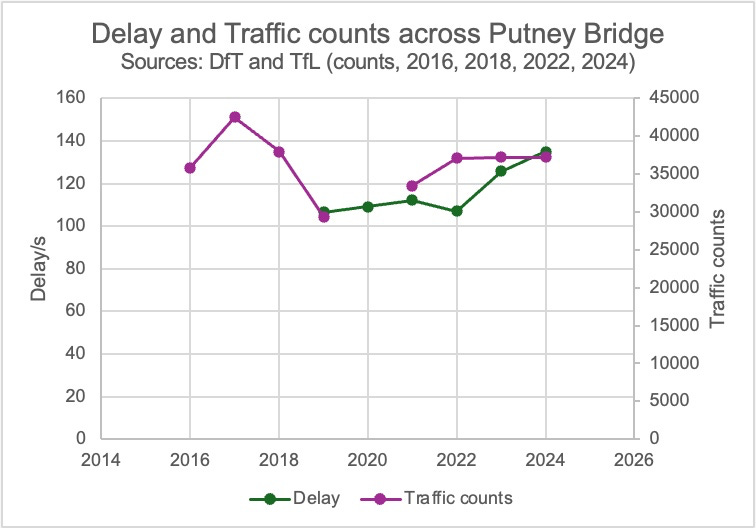
Putney Bridge shows a different idiosyncratic effect. Traffic initially fell back after the closure in 2019, but delays began to increase in 2023. That sequence of events suggests that there are other variables unrelated to the closure that are impacting travel times.
Where did the traffic go?
Cycling data provides part of the answer. Richmond Council’s survey revealed that even a few months after closure, 44% of former drivers had already switched to walking or cycling.
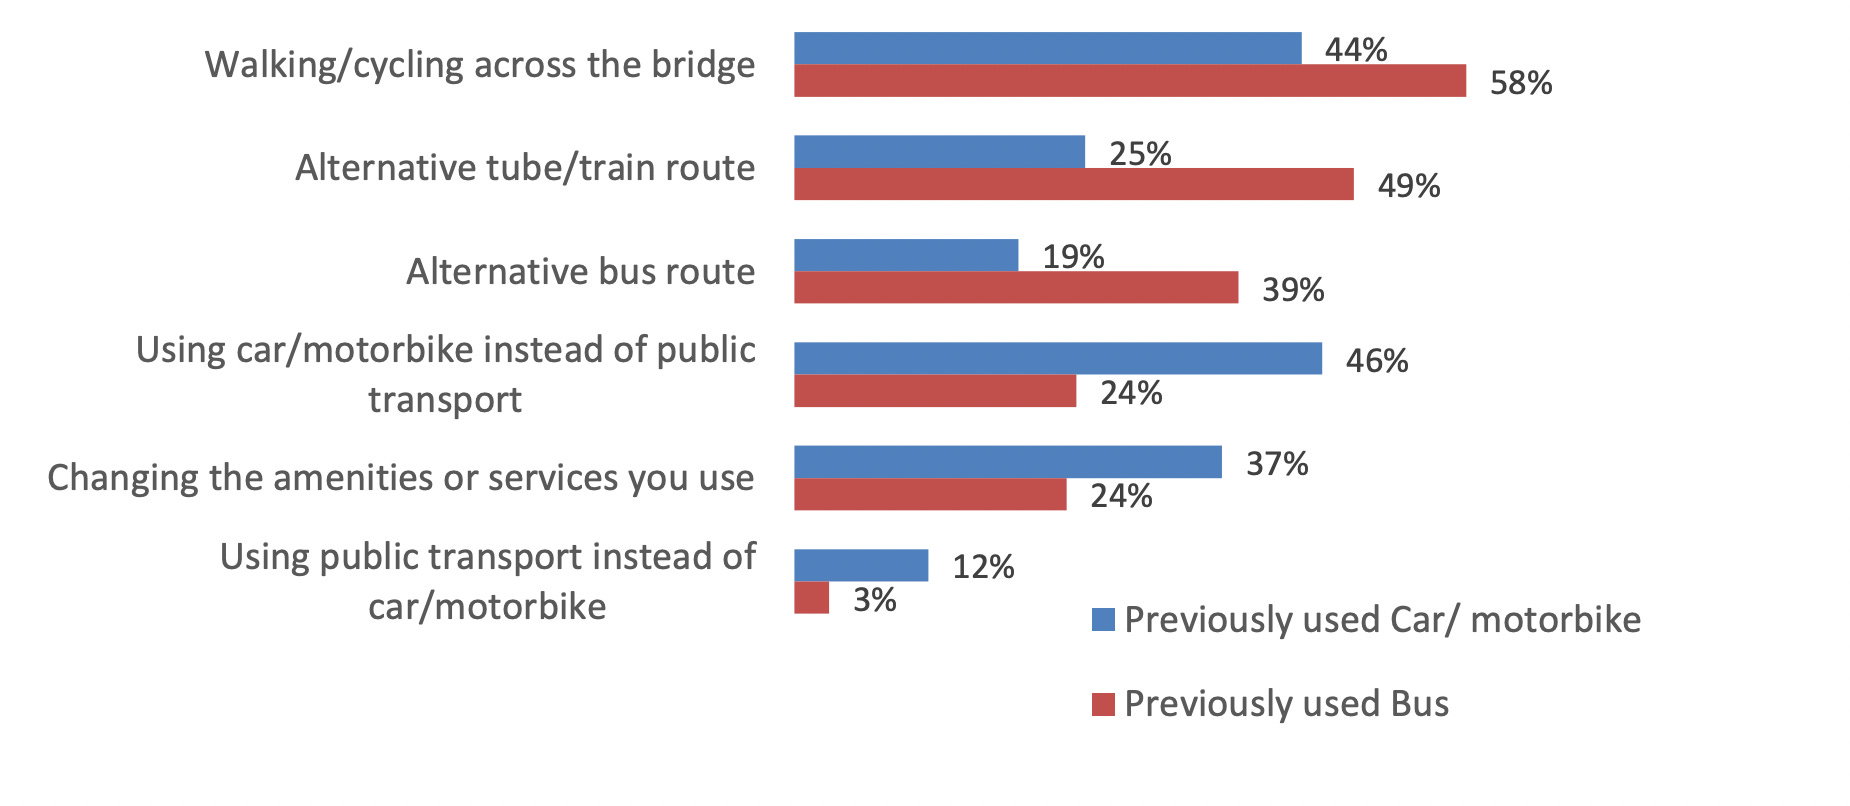
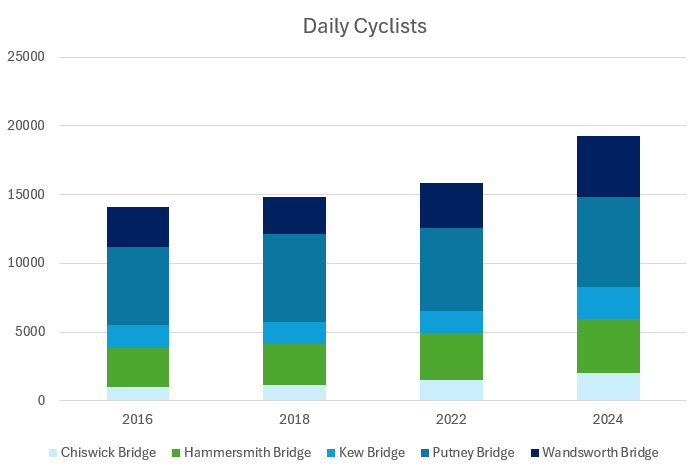
Cycle counts across the area are also markedly increased. This is known in the literature as a “modal shift”. Richmond-upon-Thames now has one of the highest active travel mode shares in Britain.
So, of the original 25,000 daily trips, most shifted to cycling, walking and public transport, and some moved to other bridges.
But here’s the puzzle: TfL reports that 9,000 vehicles (36%) have simply vanished from the road network entirely - they are no longer visible on any crossing between central London and southwest London.
What happened to those 9,000 journeys that simply evaporated?
Was economic activity lost? Were human connections severed? Did relatives stop visiting grandparents? Did businesses stop making deliveries?
The answer may lie in a counterintuitive phenomenon known as Braess’ Paradox: adding capacity to a congested network can worsen performance, while removing it can improve things.32
When drivers make individually rational routing decisions, they reach an equilibrium where no single driver benefits from changing route, but this equilibrium is often inefficient for the system as a whole.
In Hammersmith’s case, the closure forced a new equilibrium. The 9,000 vanished vehicles weren’t displaced elsewhere, nor did they represent lost economic activity. They were replaced by alternatives that were more efficient in the new system.
The shopper who made three separate car trips weekly now combines errands or orders online from consolidated delivery services. The school run that meant queueing in traffic now happens on foot or by bike. The commuter who spent 20 minutes driving and searching for parking now cycles in 12 minutes.
After tube strikes, 5% of commuters permanently switch because disruption forces them to discover faster alternatives.
Hammersmith Bridge’s closure worked similarly: people tried new transport modes and often found they were better.33
What are the social and economic impacts of the closure?
When the bridge closed, TfL predicted economic contraction. The opposite occurred.
Mastercard data shows spending in Barnes increased by twice the London average.34 Spending increased +21% in Barnes (SW13) and +13% in Hammersmith (W6), compared to London’s +9% average. This held even when the bridge was closed to pedestrians and cyclists.
However, this aggregate spending increase does mask a more nuanced set of changes in local business composition. Data from the same Barnes Community Association survey in 2020 suggested that specialist retailers that previously relied on cross-river customers experienced revenue declines, whilst local businesses serving residential communities tended to adapt most successfully.35
As soon as 2020, the closure appears to have reshaped Barnes’ commercial character towards neighbourhood-focused businesses rather than destination retail, potentially strengthening its role as a local high street. Now, six years later, the local economy has entirely adapted to the new reality.
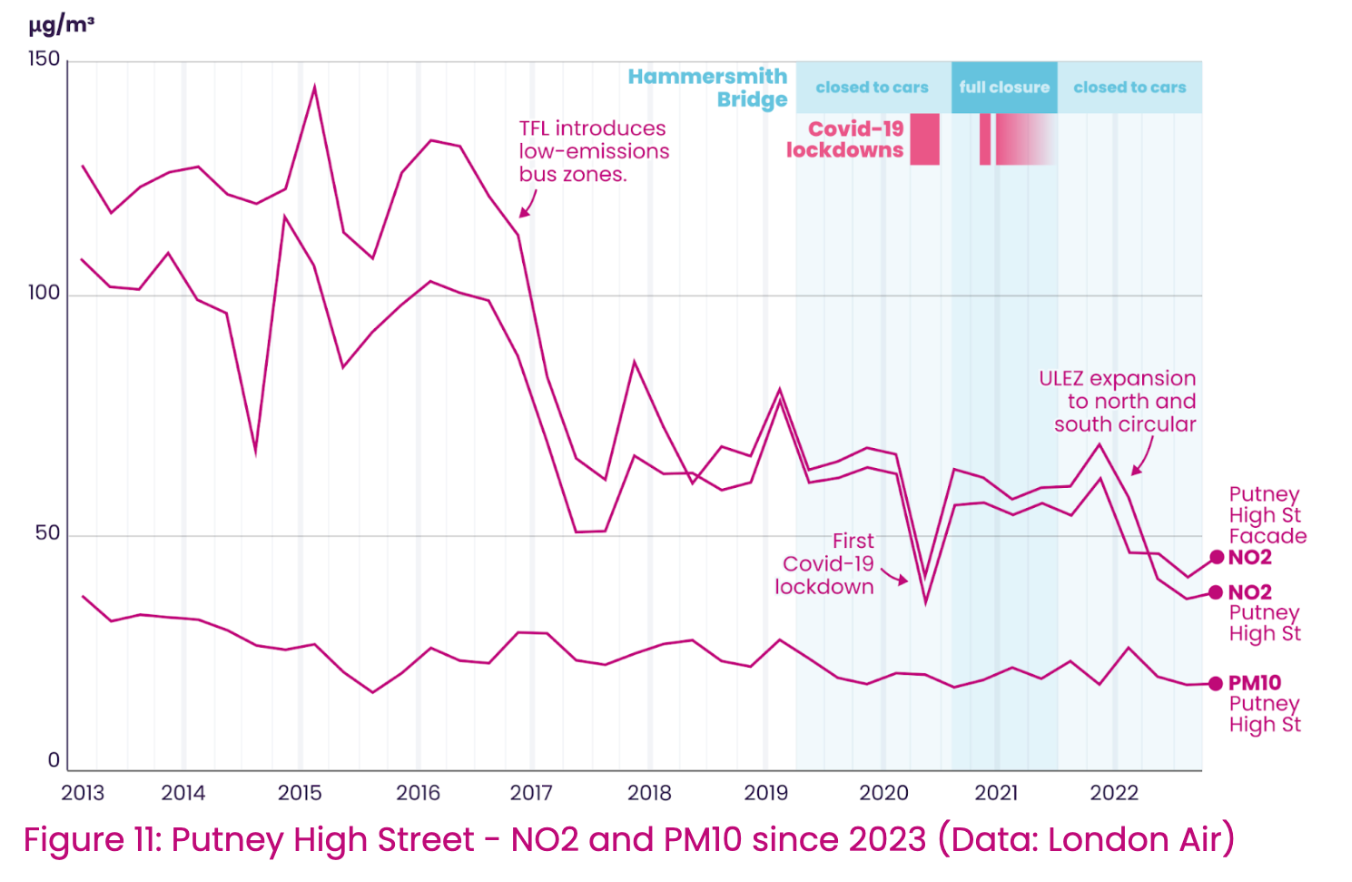
Reduced pollution likely increased dwell time and spending given that air quality improved at every monitoring station across the region, with nitrogen dioxide levels dropping significantly in Hammersmith, most of Barnes, and even Putney.
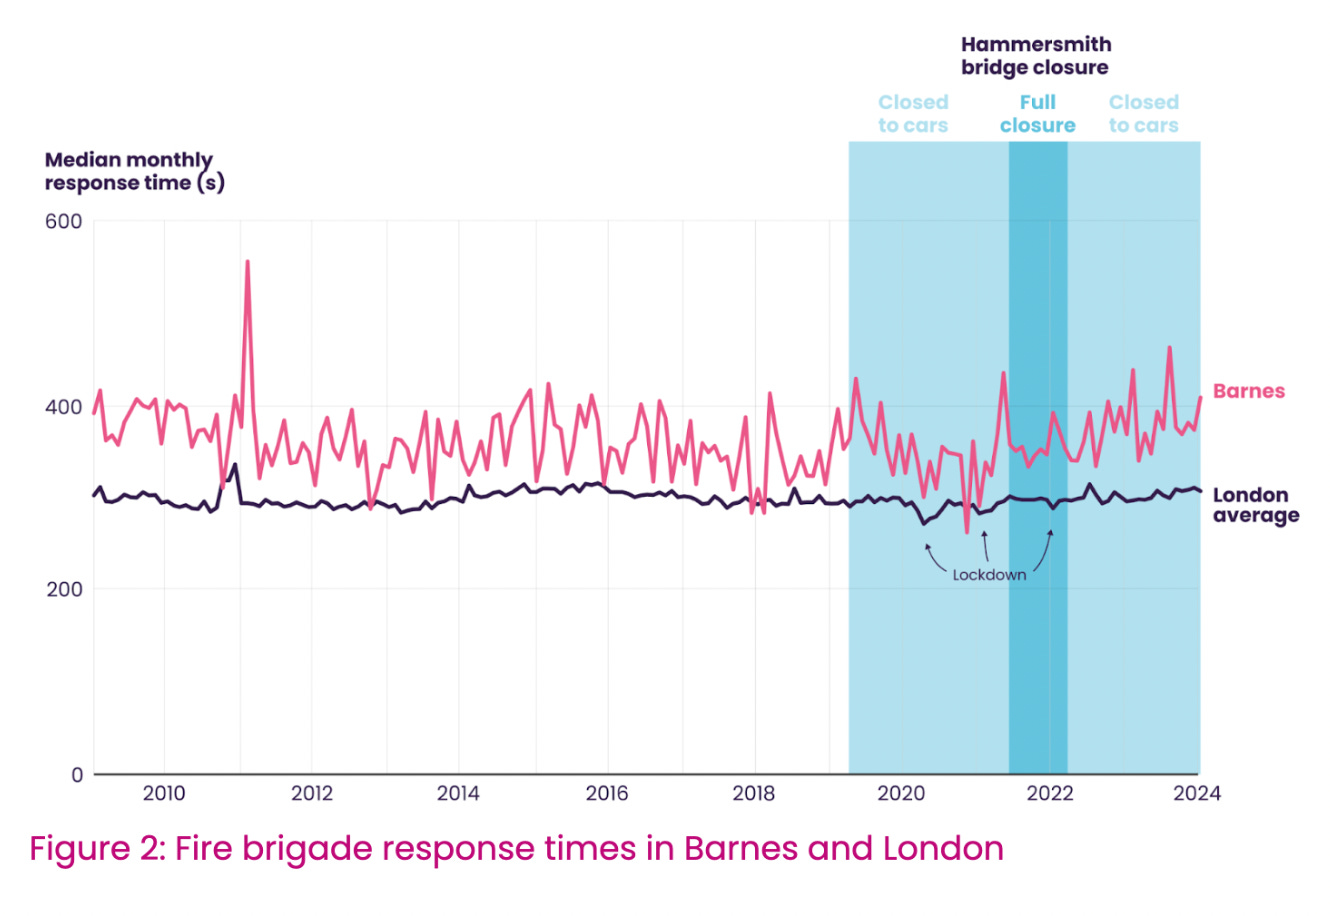
Emergency services have reported no impact on response times. The London Ambulance Service stated they have “never released any information about the closure impacting response times,” whilst London Fire Brigade data shows no increase in 999 response times in the Barnes peninsula.
West London’s economy hasn’t contracted; it has adapted. This isn’t suppression of activity; it’s optimisation. Economic vitality requires efficient connectivity, not maximum motorised vehicle throughput.
However, there are important confounding factors.
Since 2019, the entire urban transport landscape has transformed through three major forces largely independent of the bridge closure.
The pandemic (normalising remote work and collapsing commuter traffic), regulatory changes (Low Traffic Neighbourhoods, ULEZ expansion, 20mph zones), and new infrastructure (Elizabeth line, expanded cycling networks).
Disentangling the bridge closure’s impact from these confounding factors is nearly impossible, so it is not possible to attribute all these changes definitively to the bridge closure.
But one impact is clear: west London has adapted to reduced car dependency regardless of whether the bridge closure drove or merely coincided with these changes.
It is not necessarily the case that closing bridges improves transport; but it is undeniably true that people and places adapt when given alternatives.
Infrastructure shapes behaviour.
Who has been genuinely disadvantaged by the closure?
The closure has created genuine hardship for specific groups.
Elderly and disabled residents have been significantly disadvantaged, having lost direct bus routes across the river to Hammersmith with its step-free Tube access, retail outlets and major hospital.36 Low-income residents have been disproportionately affected. They’re less likely to own cars or bikes, cannot afford taxi detours, and have lost affordable public transport options. Parents with young children face new challenges. Cycling is not always an option, so any journey across the river has become significantly harder.
Specialised retailers have also lost business. Whilst generic local businesses saw spending increases, specialised retailers relying on customers from across London experienced revenue reductions. Similarly, tradespeople and businesses requiring vehicle access face longer detours. Plumbers, electricians, and builders transporting heavier tools lose time and income. Commercial motorised vehicles merit particular attention given ULEZ parallels, where delivery operators have raised concerns about regulatory burdens. However, unlike ULEZ, the bridge closure affects routing rather than compliance costs.
As a local resident who crosses the bridge every week, I see both sides of this argument:
For certain residents and businesses, the closure has created genuine hardship. Equally, however, the constant gridlock has vanished, the local economy has adapted, and cycling - previously a life-threatening exercise - is now pleasant and safe.
The harms are real, but they do not require a £250m car-restoration project. They require targeted public transport solutions.
What do locals state as their preferred solution?
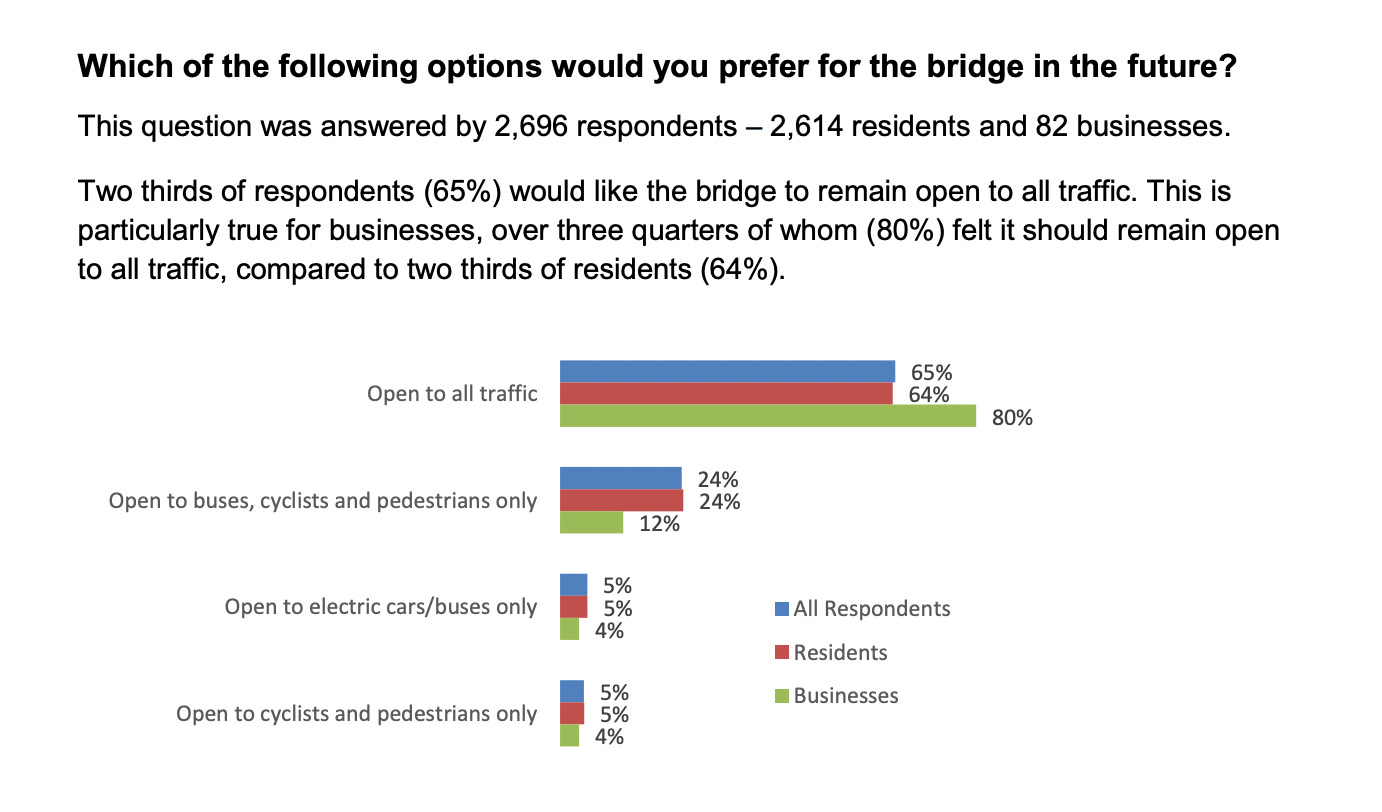
Ask residents if they want the bridge reopened to all traffic and the answer is obvious: yes.
Maximum choice will always seem the most convenient option.
But that is the wrong question to be asking. As we have established, a full restoration would cost £250m, take years, and likely require a significant vehicle toll.
Given that reality, what’s the best option?
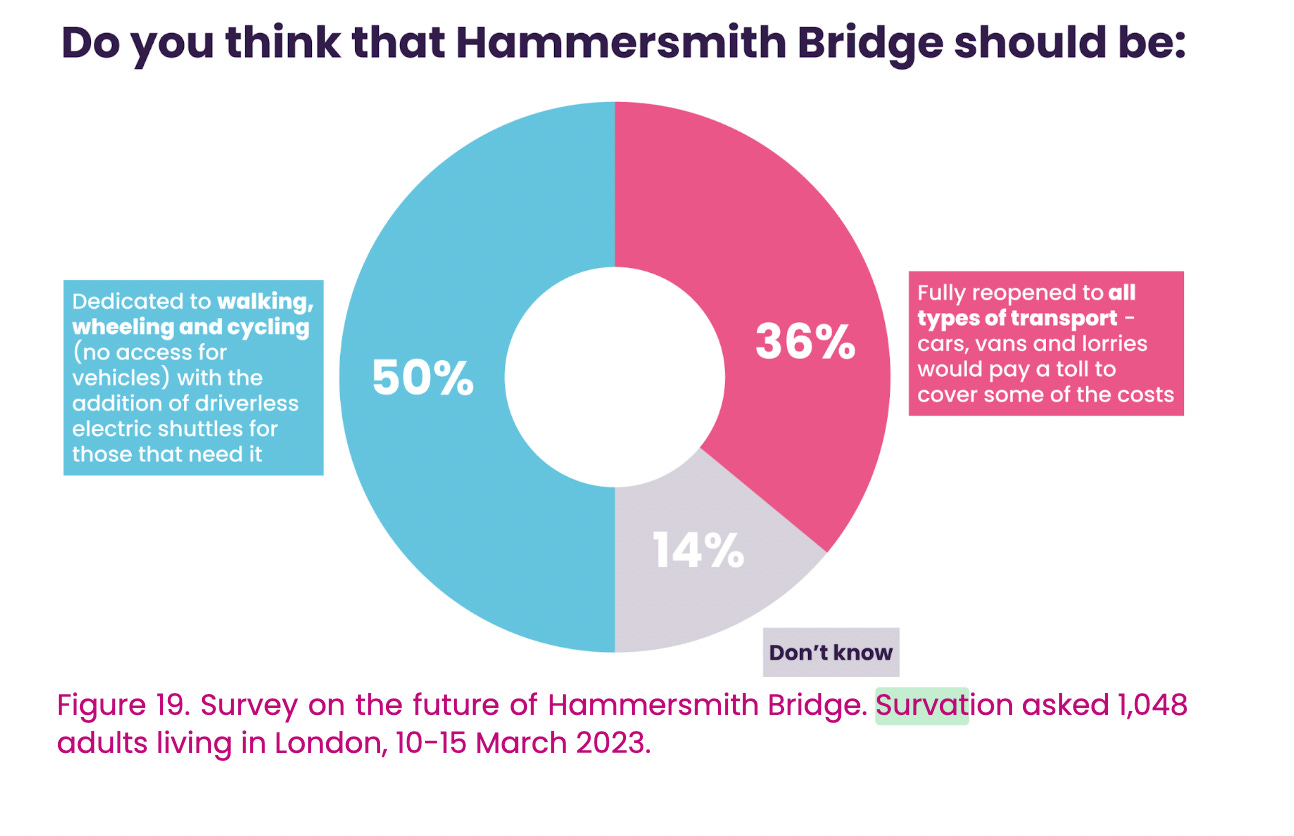
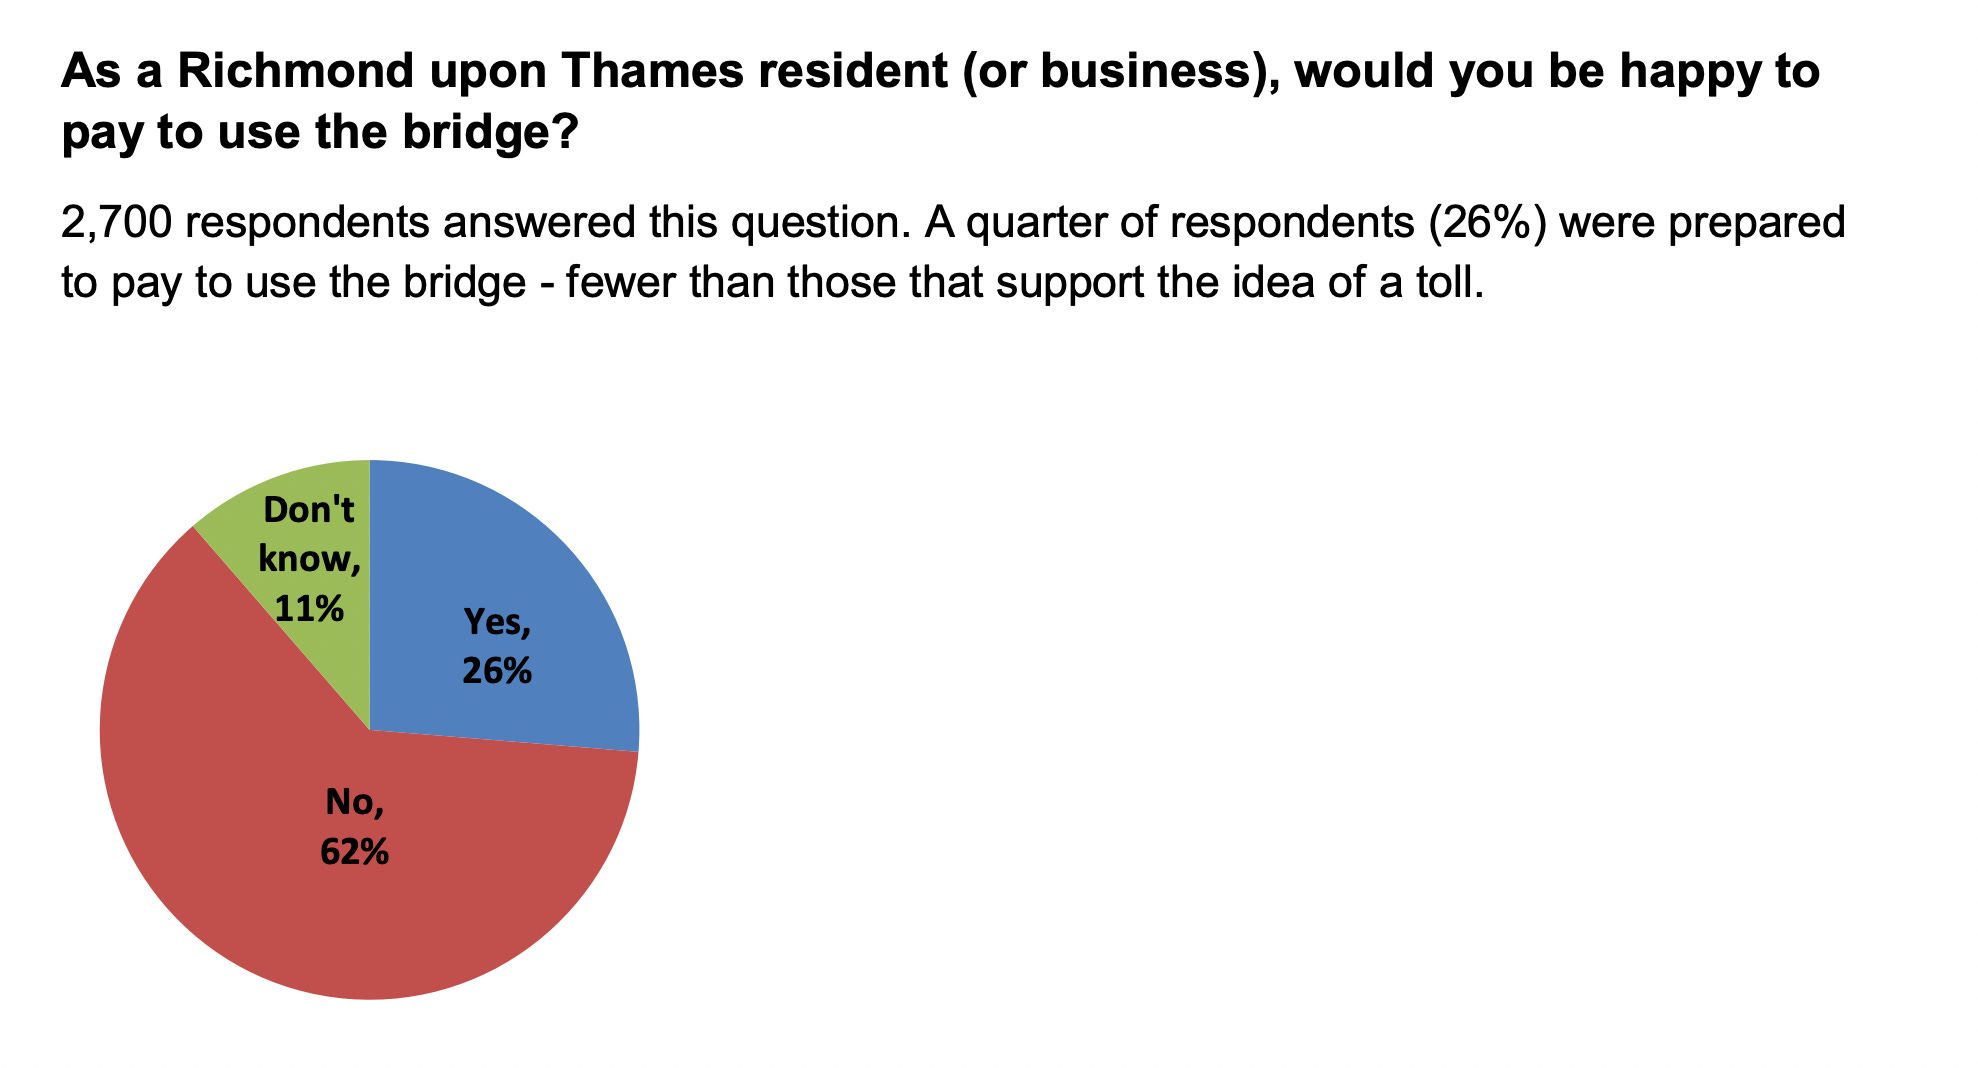
A 2023 poll tested this exact trade-off, and the response from residents was clear. If the alternative was a toll bridge, 50% of respondents would prefer a car-free bridge with cycling, walking and electric shuttles, with 36% in favour of tolling. Similar results were shown in a FareCity survey from 2019.
Given the actual constraints and costs, residents prefer targeted public transport solutions over expensive vehicular restoration.
Is the bridge legally required to reopen to cars?
Finally, we should address a claim that has shaped the entire debate.
Labour Council leader Stephen Cowan has repeatedly stated that the bridge is “legally required to reopen to cars,” indicating that the Secretary of State instructed him on the council’s “Highways obligations.” This assertion has anchored political negotiations around how to restore full vehicular capacity. Mayor Sadiq Khan has also expressed a desire to re-open the bridge to cars.
But in November 2022, the Department for Transport’s Freedom of Information response categorically contradicted this claim:
“The Department has not given any legal instructions to London Borough of Hammersmith and Fulham regarding the management of the bridge – officials and Ministers have been clear that LBHF is the asset owner and decisions on maintenance and repair are for it to take.”
As the owner, there is no clear legal requirement for the Council to reopen the bridge to cars (as they have likely met their statutory obligations,37 although any formal highway downgrading would require Traffic Regulation Orders under established statutory procedures).38
This distinction is not semantic pedantry. If the obligation is political rather than statutory, then the solution space is fundamentally different. The council is not legally bound to pursue a £250m vehicular restoration. It could instead solve the actual mobility problem: providing public transport across the river for those who need it (which may itself be a statutory obligation).39
Yet this premise has locked the debate around restoring the existing structure to full vehicular capacity.
Part 3: Solving for the Future

So what might a solution look like?
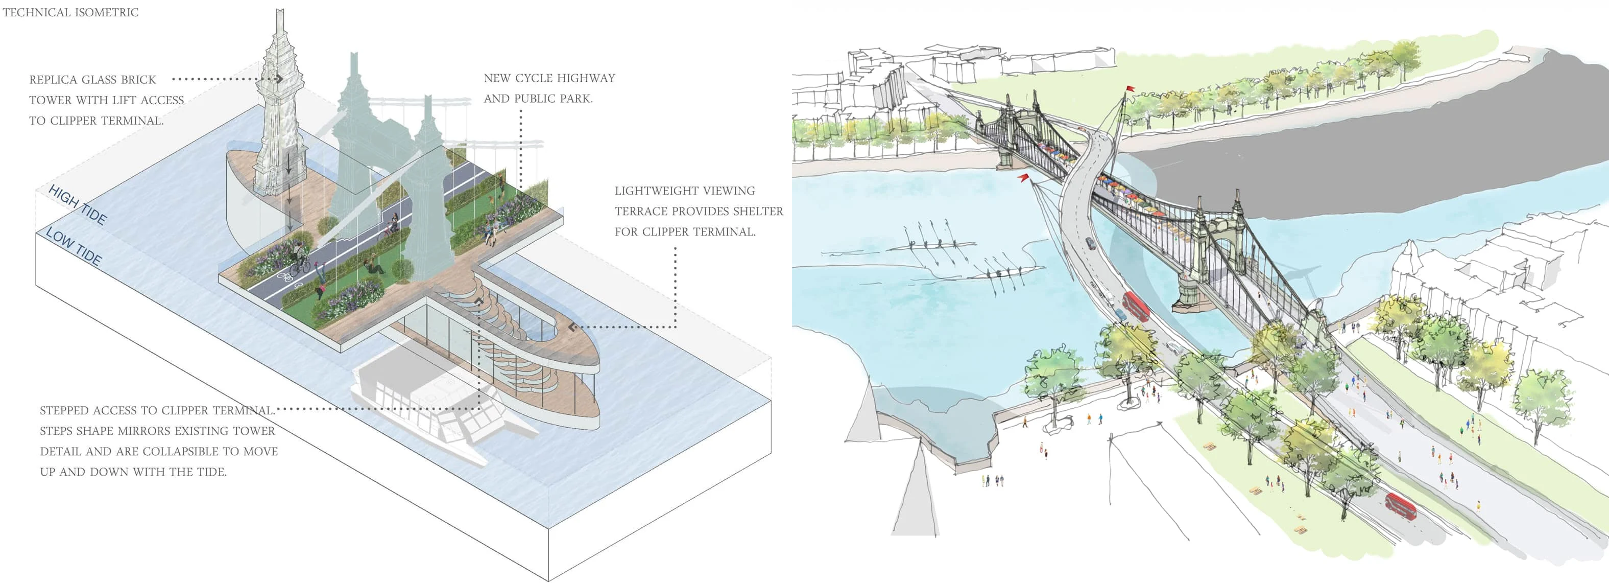
In May 2023, a credible and equitable solution for Hammersmith Bridge was proposed, fully designed and costed.
It cost £10m (25x cheaper than the Foster & Partners solution), permitted cycling and walking, fulfilled public transport needs, and crucially abided by the stabilisation’s weight restrictions.
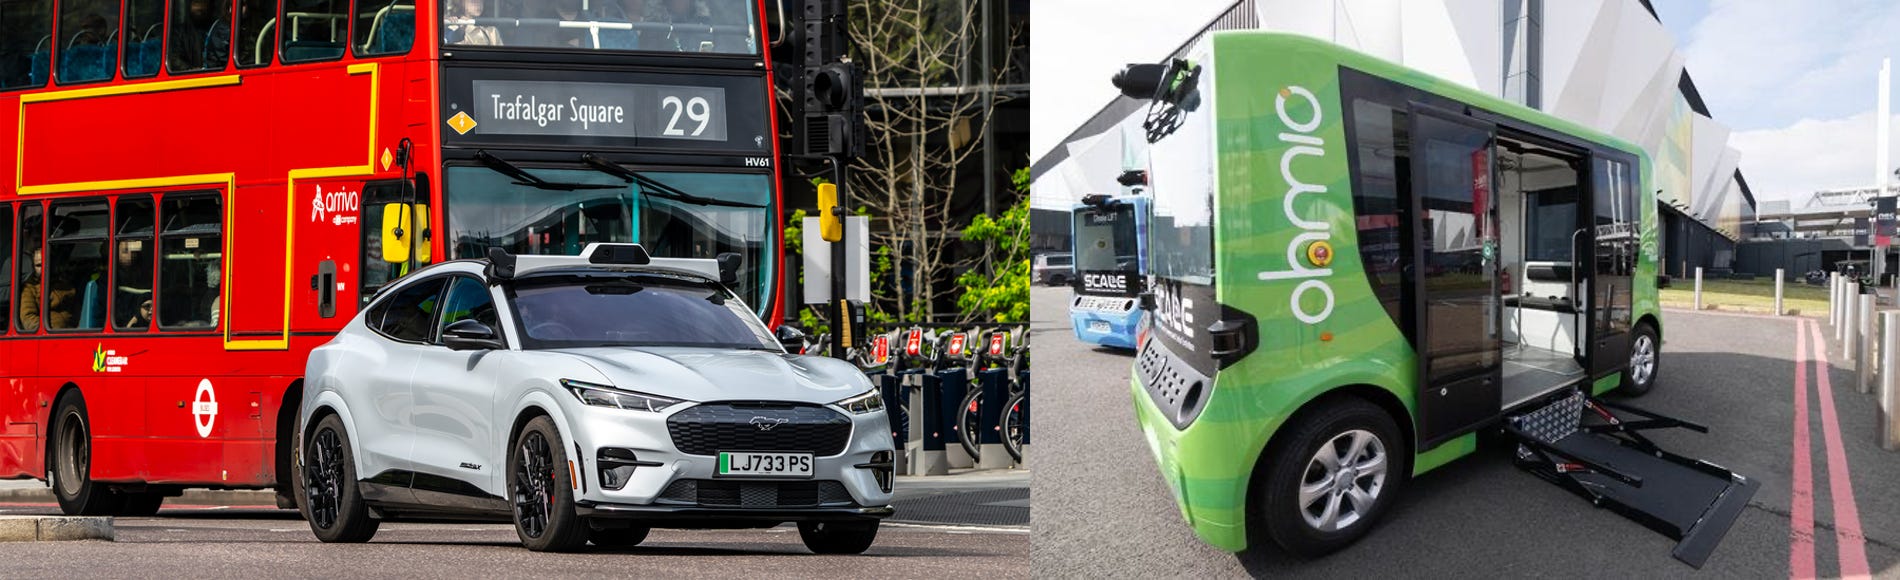
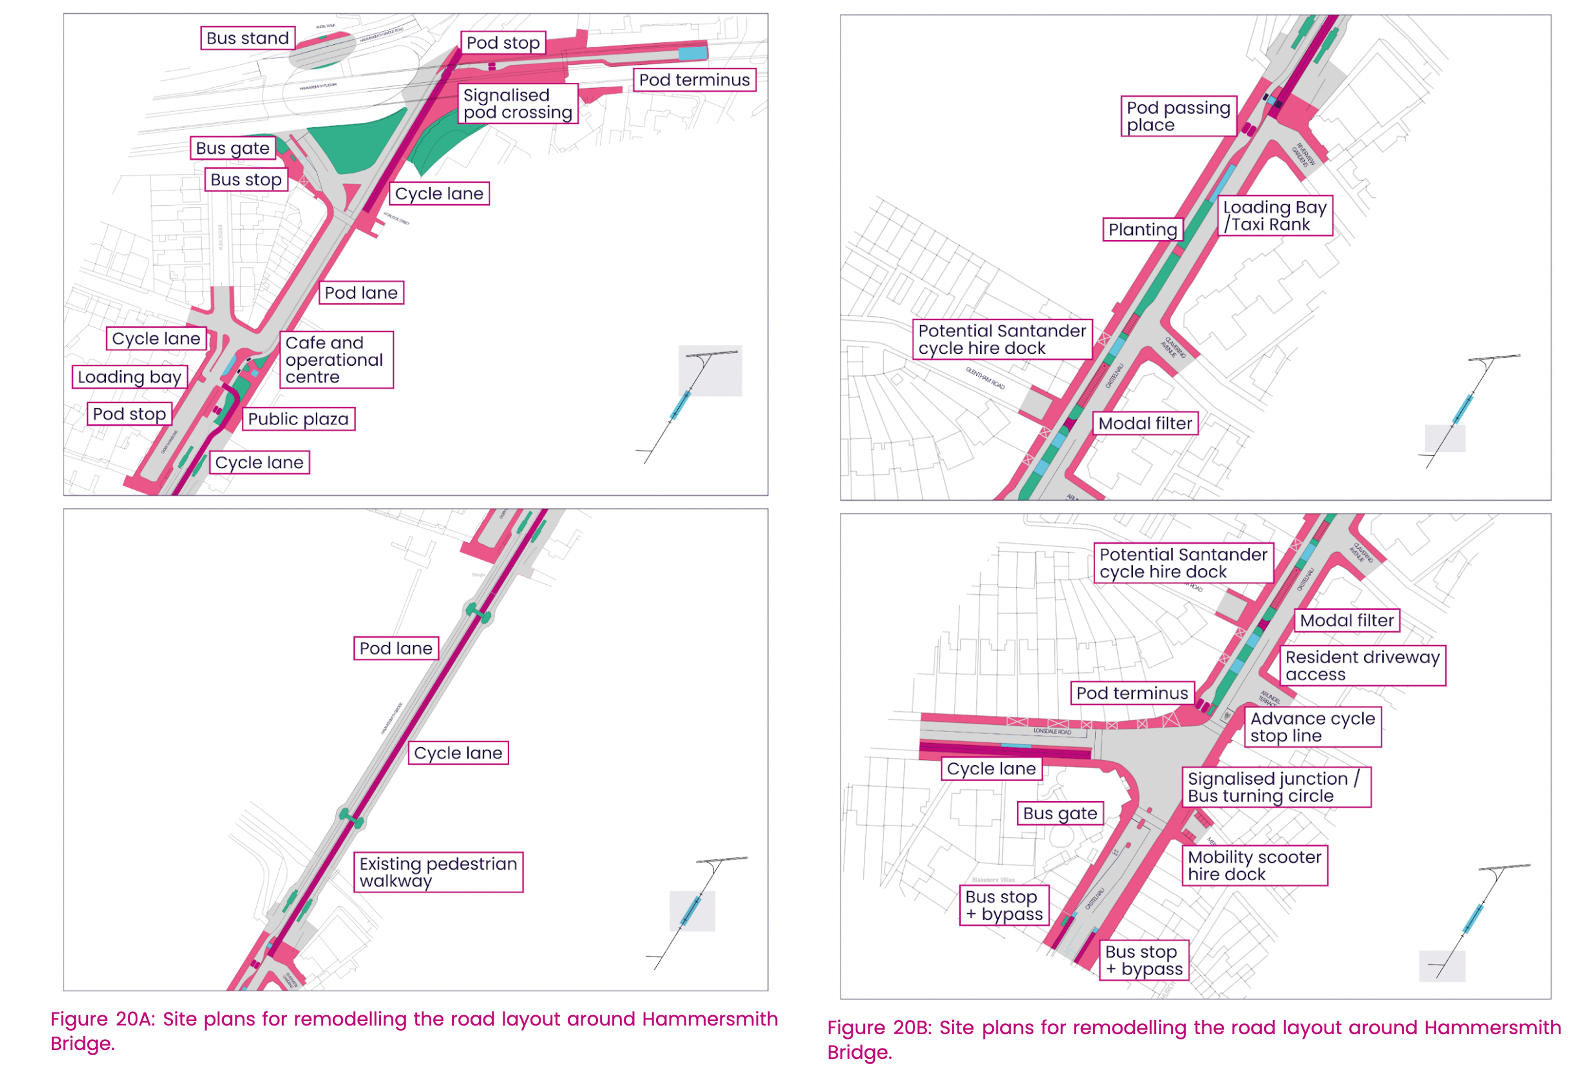
Ten-passenger autonomous electric pods, running every 2-3 minutes during peak times. Each pod weighs under 3 tonnes when fully loaded, comfortably within the bridge’s limits. The fleet would carry 235-282 passengers per hour. Full integration with Oyster cards and contactless payment. A protected two-way cycle lane alongside and pedestrian walkways. Restructured bus routes. The pods would operate in a single lane with passing points at either end.40
Total cost: £10m. Pod fleet (£3m), highways remodelling (£3.7m), public realm improvements (£0.5m), contingency (£2.8m). Timeline: 24-36 months from approval to operational.
The charity Possible spent 18 months developing this autonomous pod system for Hammersmith Bridge. The solution uses proven technology from New Zealand provider Ohmio. The pods are already used today in New Zealand and multiple international airports.
This solution addresses the genuine harms identified earlier. The autonomous pod system provides:
Public transport for those without alternatives: elderly and disabled residents regain direct access to Hammersmith with step-free boarding, young families can cross safely, low-income residents get affordable Oyster-integrated transport.
Reduced congestion for essential and commercial vehicle users: with 9,000 trips already evaporated and additional travellers using pods, tradespeople and businesses would experience a net benefit from reduced congestion on alternative crossings.
This is why the pod solution isn’t just cheaper than the £250m restoration - it’s better.
Why autonomous pods rather than conventional public transport? Standard buses weigh 12-18 tonnes, far exceeding the bridge’s 3-tonne limit. Trams require expensive track infrastructure and permanent structural modifications, the weight of which would be incompatible with heritage constraints.41 Autonomous pods solve this through lightweight design: each 10-passenger pod weighs under 3 tonnes fully loaded, with ten pods providing equivalent capacity whilst staying within structural limits. The system eliminates driver costs (60-70% of bus operating expenses) whilst enabling 2-3 minute headways impossible with human drivers, maximising throughput and cost-efficiency.
Would the pods risk obsolescence? After all, a restored bridge might serve for decades while autonomous technology is evolving rapidly. But in a rapidly changing transport landscape, the pods deliver adaptable infrastructure with manageable operating costs. Vehicles can be upgraded as technology improves at minimal cost and could be operated publicly like TfL services or through private concession with access leasing and passenger charges. In any case, the pods cost a fraction of the £250m restoration which would likely require perpetual subsidy for changing traffic patterns.
Barriers to implementation exist, but none are insurmountable. The Automated Vehicles Act 2024 already provides a legal framework, while Milton Keynes and Solihull already operate these exact Ohmio vehicles on public roads. The most likely bridge-specific challenges such as weight certification, vibration testing, structural approval are procedural requirements, not engineering barriers.
This proposal solves the actual mobility problems faced by local communities rather than restoring a traffic pattern that was already causing gridlock.
Here is the digital visualisation of the proposal (no sound):
What happened to this proposal?
The Centre for Connected and Autonomous Vehicles offered £200,000 for feasibility studies. Possible assembled a consortium including Ohmio, City Science, and City Infinity. Richmond Council and TfL both agreed to support if Hammersmith & Fulham agreed.
Hammersmith & Fulham refused to engage. The deadline passed. The consortium disbanded.
Since then, Ohmio has begun trials in Solihull and Milton Keynes. Waymo and Wayve will trial autonomous taxi services in London in 2026.
The opportunity for the UK’s first autonomous public transport deployment was lost, but the solution remains viable.
Call to Action
What needs to happen now?
End the pretence. LBHF, TfL and DfT must publicly acknowledge what everyone privately knows: the restoration (£250m+) is unfunded and any replacement (£150m+) is equally unfundable.
Open a competitive tender. Tender for public transport solutions within the stabilised bridge’s 3-tonne weight limit. Offer clear requirements: passengers per hour, Oyster-integrated, delivery timeline.Let the market find the most cost-effective solution. Fast-track regulatory approval for the winning proposal. No multi-year planning inquiries for a bridge that’s already been closed for six years.
Create the destination, invest in the approaches. All three bodies also need to invest in regenerating areas at either end: the retail outlets, cycling infrastructure, public realm upgrades, drainage improvements (co-ordinate with the Hammersmith Flyover redevelopment if that proceed).
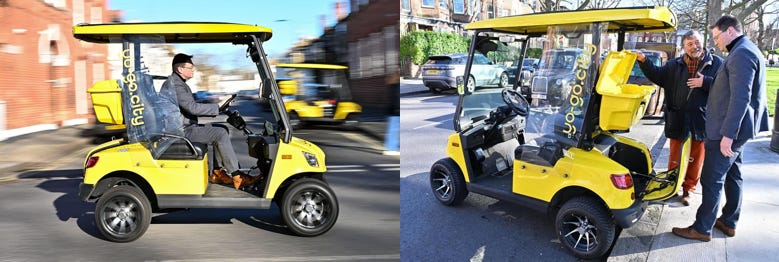
Recently, there have been some more positive signs. Various local politicians have begun to more clearly express support for prioritising a public transport solution over simply re-introducing cars. LBHF recently trialled yellow rental carts, demonstrating an appetite for testing new modes of transport.
Building the Future
The Possible proposal would have been the UK’s first autonomous vehicle deployment in real-world public transport.
Hammersmith Bridge offers the perfect testing ground: dedicated straight lanes, low speed, controlled environment. The Government has stated its ambition for technology leadership in autonomous vehicles.
That opportunity was lost when LBHF refused to engage, but the solution remains viable.
The bridge is stabilised. The community has adapted. The technology exists. What’s required is simply the political will to choose the future.
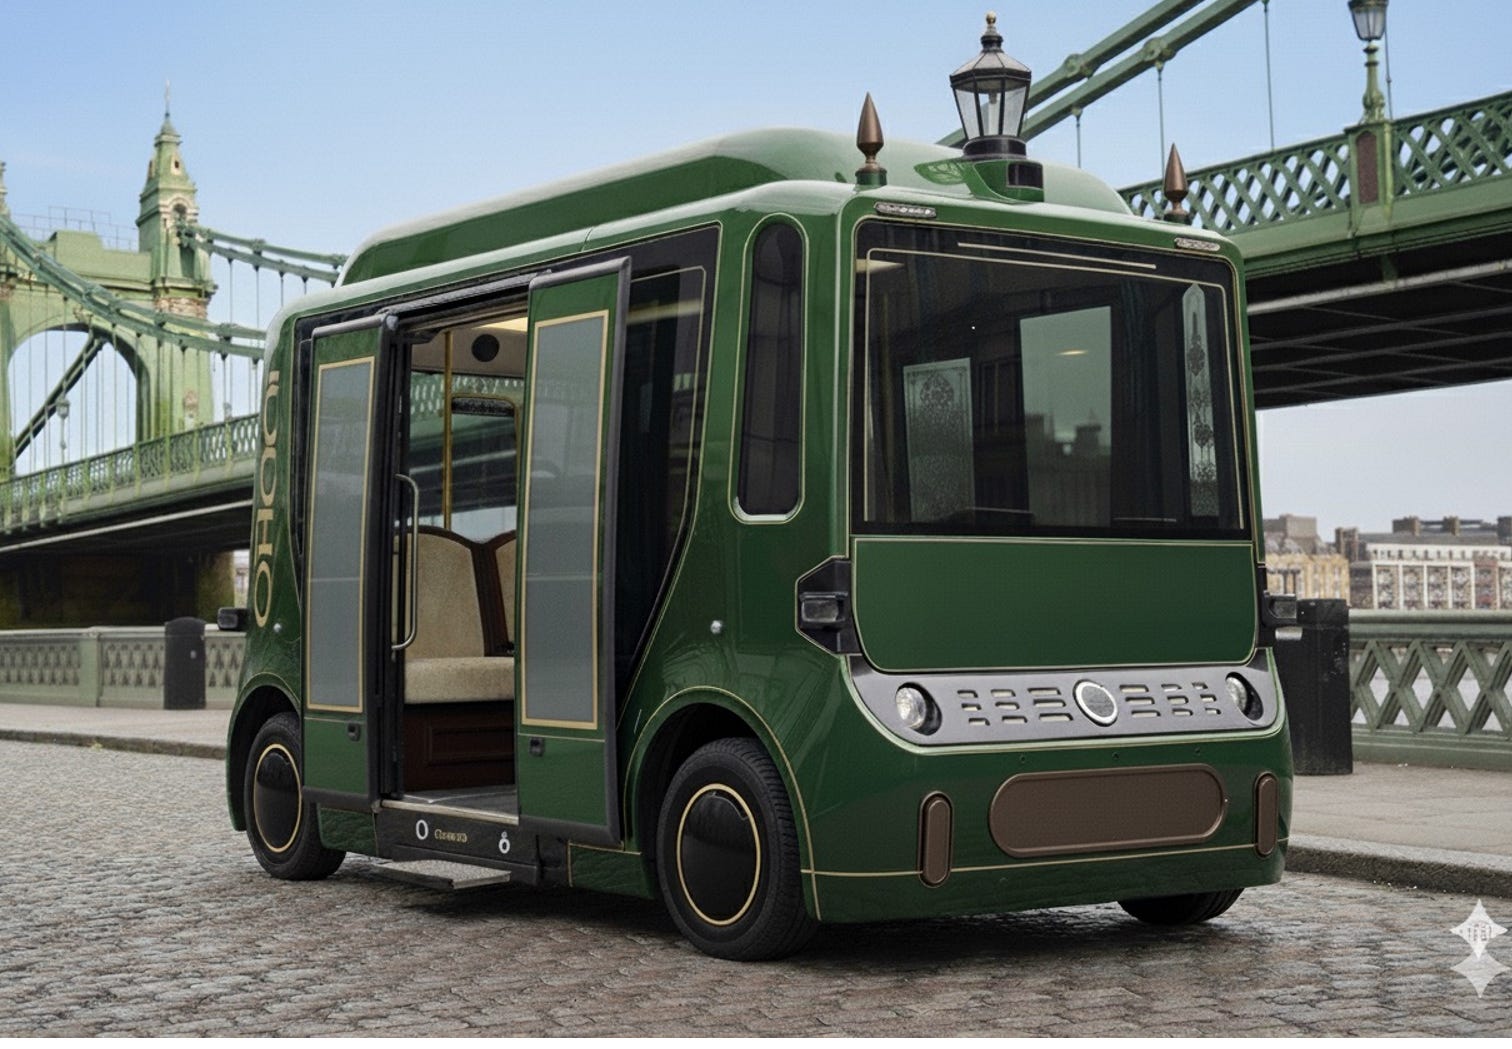
Hammersmith Bridge could become a place where Victorian ironwork frames cutting-edge technology. London’s greenest historic crossing could be the testing ground for Britain’s most advanced public transport solution.
Picture it at dusk: Victorian lampposts glowing, pods gliding silently past, cyclists heading home, the swans gliding along the Thames below. The bridge would no longer be a bottleneck that motorists endure, but a bridge people choose to cross.
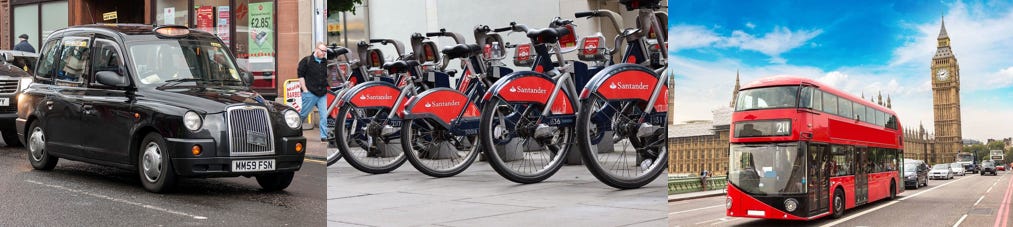
Designed thoughtfully, Hammersmith Bridge’s public transport vehicles could become a timeless and recognisable feature of London’s urban landscape, alongside other distinctive British icons — red telephone boxes, double-decker buses, or black cabs.
That’s the future for Britain that we should be building - one that is even more beautiful than the past we’re failing to resurrect.
Hammersmith Bridge can be one of the greatest river crossings in the world.
Please do get in touch if you are in a position to help solve this challenge or have any feedback.
Let’s build the future.
Postscript: Fixing Britain
Will this solution help us solve the vast problem of Britain’s state crisis?
Of course not.42
But Hammersmith Bridge teaches a lesson.
Here, the intuitive question based on past assumptions was “how do we restore full vehicular capacity?” The real question we should have been asking ourselves is “how do we solve this mobility problem to ensure a better future?”
While we debate how to restore Victorian infrastructure for outdated traffic patterns, the actual future, autonomous and mass public transport, is materialising around us.
In that sense, Hammersmith Bridge serves as a warning.
If we can’t adapt our thinking here, what hope is there for the toughest problems that we face? For the infrastructure that Britain actually needs to build? For the critical state capacity that we most urgently need to develop?43
Hammersmith Bridge is the case study; now Britain must start asking the right questions.
Acknowledgements
This essay was possible because kind people cared enough to help.
Above all, I would like to thank Leo Murray, who led the charity Possible and wrote a definitive report on Hammersmith Bridge which informed so much of this information in this piece.
Tom Pike, Tim Lennon, and Charles Campion generously shared their expertise, data, and years of work on this problem. Their rigorous research and genuine commitment to solving the bridge’s crisis made this analysis possible.
The Looking for Growth team, Lawrence, Ludo, and Jack, provided invaluable support and encouragement throughout.
I am deeply grateful also to friends Quentin, Aeron, Paramvir, Bob and Jemima, who read early drafts and offered thoughtful feedback.
Finally, my most sincere apologies to every friend, family member, and innocent bystander who endured my monologues about Hammersmith Bridge these past months.
Disclaimer: All posts on this site reflect my personal views only and should not be construed as investment, financial, or professional advice. These views do not represent my employer or any affiliated organisation.
Bibliography
Possible & Leo Murray (2024) Hammersmith Bridge Report
Tim Lennon (2024) Hammersmith Bridge
Barnes Community Association & Emma Robinson (2020) The Impact of the Closure
LBHF Resources:
LBHF (2025) Hammersmith Bridge
LBHF (2024) Stabilisation Works
LBHF (2020) Hammersmith Bridge Timeline
Local Groups:
Footnotes
Source: Bank of England Inflation Calculator. Taking the mid-date of the construction period and inflation adjusting to August 2025 values.
London’s Private Bridges 1729-1873. By 1827, London had several Thames crossings, including medieval London Bridge, Westminster Bridge (1750), and Blackfriars Bridge (1769). Some were toll-free, creating competitive pressure that doomed most private ventures. The Hammersmith Bridge Company raised £80,000 and operated profitably until the Metropolitan Board of Works bought it in 1880, removing tolls. After boat damage in 1882, Bazalgette’s suspension bridge opened in 1887 at £82,117. Of six major private Thames bridges built 1729-1873, only Putney (10-12% annual dividends over 151 years) and Hammersmith proved viable. The rest failed catastrophically. Waterloo lost 52.5% on £1m investment. Southwark cost £700,000 but earned just £5,044 in first-year tolls, selling for 31% of construction costs. Toll-free alternatives and high maintenance made private ownership unsustainable. Hammersmith & Fulham’s plan to fund £250m restoration through tolls reverses this failed model, asking contemporary motorists to subsidise heritage infrastructure that proved unviable even in the Victorian era’s more permissive toll environment.
The Széchenyi Chain Bridge. Clark’s 1827 design was internationally significant. Hungarian Count István Széchenyi visited England in 1832 for bridge design ideas and so admired Hammersmith Bridge (and Clark’s similar design for Marlow Bridge) that he commissioned Clark to build a sister bridge in Hungary. That bridge, Budapest’s Széchenyi Chain Bridge (1849), is now Hungary’s national symbol and tourist destination. It was the first bridge linking Buda and Pest across the Danube. During construction, a broken link sent 400 tons of iron into the river, nearly killing Széchenyi watching from a boat. After German forces destroyed it in 1944, Hungary rebuilt it by 1949. Budapest’s bridge is also currently closed for major refurbishment with similar government cost disputes. Source: Institution of Civil Engineers

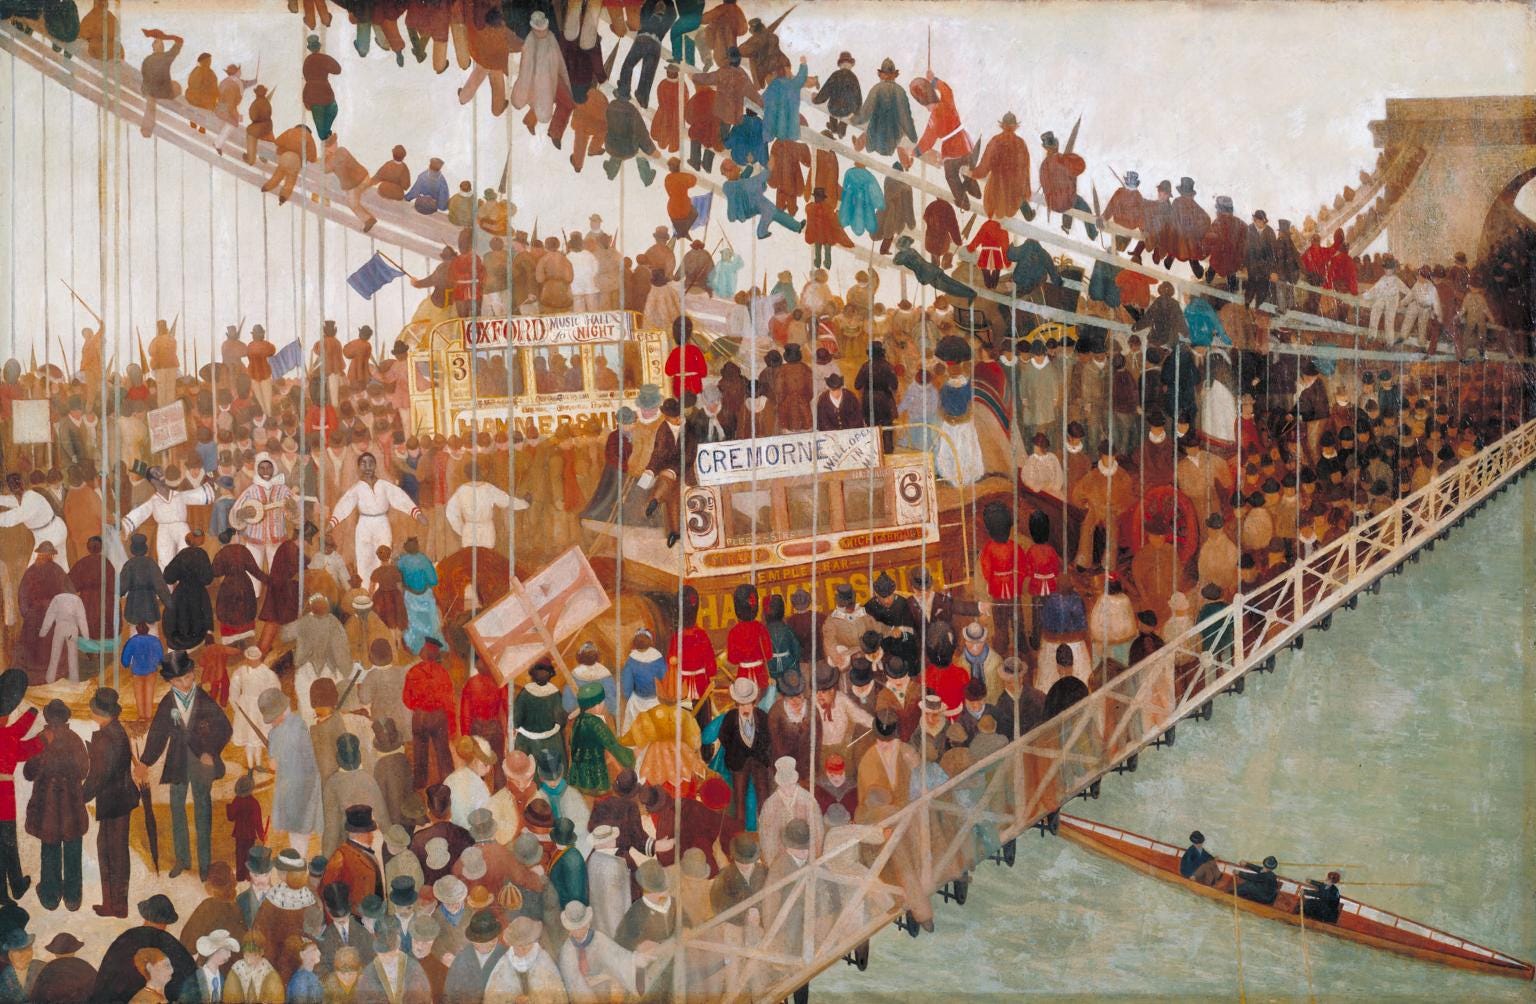
Walter Greaves’ 1862 picture depicts the bridge with a dense crowd assembled to watch the annual Oxford-Cambridge University Boat Race. In the 1870s, there were fears that the bridge was not strong enough to support the weight of heavy traffic when around ~12,000 people would gather there for the event. Greaves was the son of a Thames boatman and a self-taught painter.
Bazalgette’s Costs: Source: Grace’s Guide: Hammersmith Bridge.
1887: “Before the demolition of the old bridge a temporary structure was thrown across the river on the west side… The designers of the bridge were Sir Joseph and Mr. E. Bazalgette, and the contractors Messrs. Dixon and Thorne, the contract price being £82,000.” Source: Pall Mall Gazette - Saturday 18 June 1887
1887: “The cost of the new bridge has been about £83,000, and it has been erected with remarkable expedition under the supervision of Mr. George Double, the energetic manager of Messrs. Dixon and Thorne, tho building having taken just two years, reckoning from the date of commencement. The old bridge lasted for 60 years, and it may be interesting to mention that the iron chains were found by testing to be as good as when new. The new chains are about eight times the strength of the old ones.” Source: West London Observer - Saturday 23 April 1887.
Hammersmith Bridge Maintenance Cost Estimate. Between 1887 and 2019, the bridge received routine maintenance plus two major interventions in 1973 and 1997. Precise cumulative costs are difficult to determine, but the largest expenditures were:
1972/73: “The Greater London Council has placed a £900,000 contract for the replacement of the stiffening girders and the timber deck and minor remedial works. The contract has been placed with Clarke Chapman-John Thompson Ltd. The work will be carried out by Carter-Horseley Engineers and will be supervised by the GLC’s consulting engineers Rendel Palmer and Tritton.” Source: Hammersmith & Shepherds Bush Gazette - Thursday 30 August 1973.
1997: “Hammersmith Bridge needed attention 25 years ago. The GLC spent more than £600,000 in 1972 replacing the main girders. A further £5m repairs and could be closed for two years. Obviously we can’t blame the Victorian architects for failing to predict the huge increase in road traffic .” Source: Hammersmith & Shepherds Bush Gazette - Friday 7 March 1997.
Timeline. Source: LBHF: Hammersmith Bridge and LBHF: Bridge Timeline.
IRA Attack. BBC Reporting (2000)
Structural Review. The review was commissioned by the London Borough of Hammersmith & Fulham (LBHF) to whom ownership of the bridge had been transferred in 1985 when the Greater London Council was abolished by Margaret Thatcher’s government.
1827-1879: Toll bridge owned by a private company.
1879: Purchased by the Metropolitan Board of Works (MBW) and made toll-free.
1889: Transferred to London County Council (LCC) which replaced the MBW.
1965: Transferred to the Greater London Council (GLC) during local government reorganisation.
1986: Transferred to London Borough of Hammersmith and Fulham (LBHF) when the GLC was abolished by Margaret Thatcher’s government.
Source: Evening Standard, 11th April 2024.
Council Leader Stephen Cowan reflects on the decision-making process here:
Stabilisation Works. Plans designed by Mott MacDonald. The casings of the four corner cast-iron pedestals were then removed and the pedestals were filled with fibre-reinforced concrete. This work was undertaken by contractor FM Conway and their sub-contractors, Freyssinet Ltd and Taziker Industrial Ltd.
“Following the Stabilisation Works, consideration will be given to the interim reopening of the road carriageway to special vehicle(s) which, at the time of writing, would be restricted to 3T GVW.” LBHF Freedom of Information request, 16th May 2022.
1887 Bridge Construction Cost Structure Estimates
Total cost (£83,000): Contemporary newspaper reports cite contract price of £82,000-£83,000 paid to contractors Dixon, Appleby & Thorne (Pall Mall Gazette, West London Observer, June 1887). Inflation adjustment to 2025 values (£9.4m) calculated using the Bank of England historical price calculator.
Category breakdowns: No itemised accounts located in public archives. Estimates based on:
Materials (50-65%): Technical specifications in The Engineer magazine (1887) detail approximately 1,000 tonnes of steel and cast iron. Victorian construction was materials-heavy, with iron and steel dominating costs due to the tonnage-intensive nature of bridge building.
Labour (25-35%): Victorian labour costs were relatively low due to abundant workforce. No minimum wage, safety equipment costs, or regulatory overhead existed.
Professional fees (5-10%): Standard Victorian engineering fee structure for major infrastructure. Sir Joseph Bazalgette served as chief engineer with his son Edward as deputy. Dixon & Thorne as sole contractor. This is a minimalistic professional team compared to modern practice.
Equipment (5-10%): Simple scaffolding, barges, cranes, and hydraulic presses. Victorian equipment costs were proportionally modest.
Regulatory & compliance (0%): No heritage protection legislation, environmental assessment requirements, or modern health and safety regulatory framework existed in 1887.
2019 Stabilisation Work Cost Structure Estimates
Total cost (£48m): Confirmed by Hammersmith & Fulham Council reports covering stabilisation expenditure since bridge closure in 2019.
Category breakdowns: Estimated using modern construction industry standards and disclosed project information:
Materials (20-25%): Custom steel frames manufactured from 1,220 bespoke pieces cut from 29 imported sheets. Over 1,000 deck and footway panels replaced. Modern heritage work is less materials-intensive proportionally than Victorian construction.
Labour (35-45%): Average construction wages reached £739/week in March 2024. Heritage specialists with expertise in historic properties charge premium rates. Labour represents the largest expense in modern construction due to skilled nature of work and safety requirements.
Professional fees & design (15-20%): Multiple specialist consultancies involved: Mott MacDonald (design), FM Conway (main contractor), Freyssinet and Taziker (sub-contractors). Professional fees for heritage architects and consultants significantly exceed standard construction.
Regulatory & compliance (10-15%): Listed Building Consent and heritage consultant requirements mandatory for Grade II* structures. Archaeological oversight, planning consultations, and environmental assessments add substantial costs absent in Victorian construction.
Risk, insurance & contingency (5-10%): Steel procurement delayed due to Ukraine war. Modern projects require extensive professional indemnity insurance, public liability coverage, and contingency provisions for complex heritage work.
Contractor overheads (5-8%): Standard modern construction overhead rates, proportionally similar to Victorian era.
Funding Arrangement. Confirmed by the March 2021 funding agreement for the bridge’s stabilisation works.
Rickshaws.High costs mean this would only substitute for taxi journeys, not public transport.
Back-of-the-envelope toll bridge calculation: LBHF estimates £7.5m annual finance costs for its £83m share (one-third of £250m total). If tolls cover all costs, that’s £22.5m yearly. Adding £1.3m maintenance and 15% collection costs requires £27m annually. Pre-closure, 18,000 private cars crossed daily. LBHF plans resident exemptions and expects lower usage. The M6 toll comparison is instructive: despite saving 40 minutes at £10.50 daily, only 15% of M6 traffic uses it. Applying this to Hammersmith Bridge yields just over £10m annually before resident exemptions, less than half the required amount.
Tolling would therefore require subsidy.“H&F has made it clear it can only fund its share of the capital costs and ongoing maintenance through a toll or road user charge. A toll or road user charge would ensure that those who benefit from directly using the bridge, i.e. motorists, pay for its repair and continued operation.” Source: LBHF. Compare also this survey from Richmond Council, Source: Hammersmith Bridge Survey
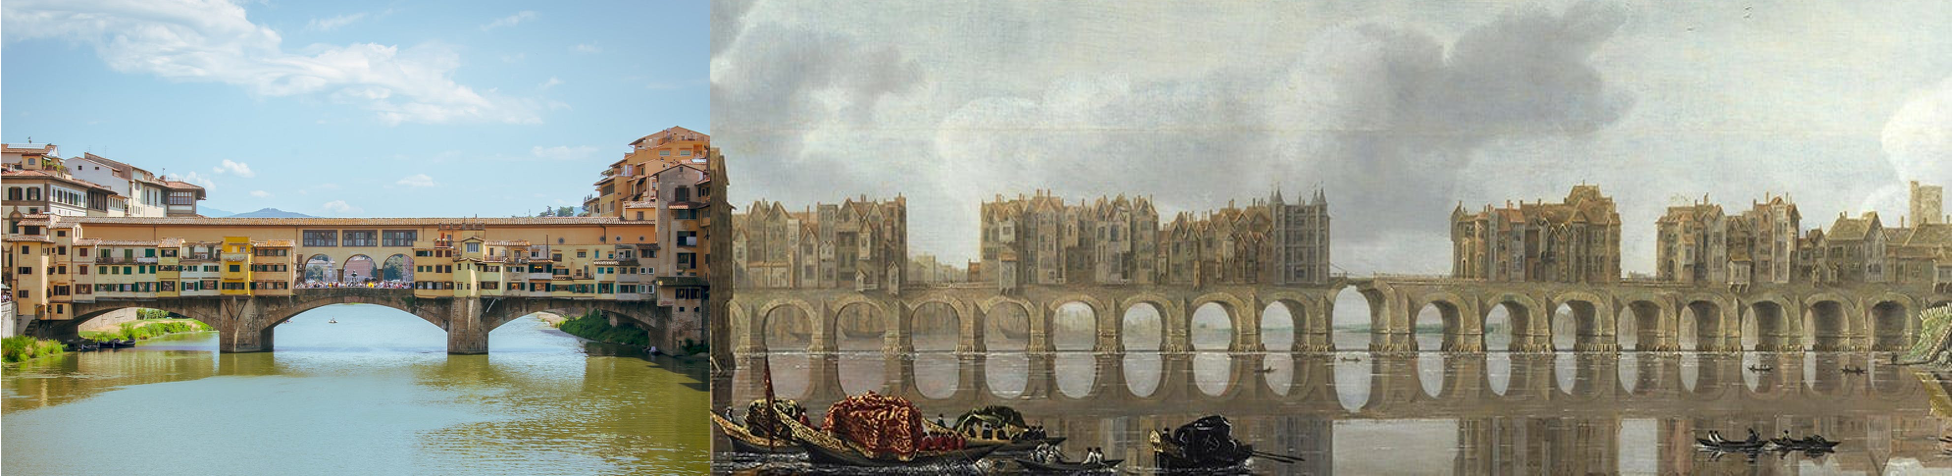
Inhabited Bridges. Lest we forget, London Bridge was once an inhabited street boasting shops and homes. Compare Florence’s Ponte Vecchio. A recent proposal for Hammersmith Flyover suggested that the council would fund a tunnel replacement by selling or leasing the land released on the ground. At at time when London is the epicentre of Britain’s housing crisis, there is surely a strong case that, if we were to re-build Hammersmith bridge we should build it to sustain buildings. The leasing or sale of the land for commercial or residential uses would fund some of the cost. One can imagine a vibrant high street springing up at this location, a tourist destination right next to major London transport centre, Hammersmith station.
The Danyang-Kunshan Grand Bridge, a 165km railway viaduct, was completed in 4 years by 10,000 workers and could span the English Channel five times.
Calculation: Danyang-Kunshan Grand Bridge is 165km long, whilst the English Channel at the Strait of Dover is 32km wide. 165 ÷ 32 = 5.16 times.
This comparison serves to demonstrate the scale of Chinese infrastructure and reminds us that Hammersmith Bridge’s 210-metre span is relatively modest. But it is worth noting that the marine conditions traversed by the Chinese bridge is markedly different from the English Channel’s busier shipping lanes, stronger tidal forces and greater maximum depths.
Chinese Bridges. At least 9 Chinese bridges exceed 32km in length, although it is worth noting that some traverse relatively shallow depths, less congested shipping routes, or carry trains rather than cars:
Danyang-Kunshan Grand Bridge - 164.8km
Tianjin Grand Bridge - 113.7km
Cangde Grand Bridge - 105.81km
Weinan Weihe Grand Bridge - 79.7km
Hong Kong-Zhuhai-Macau Bridge - 55km
Beijing Grand Bridge - 48.2km
Jiaozhou Bay Bridge - 41.58km
Hangzhou Bay Bridge - 36km
Runyang Yangtze River Bridge - 35.6km
Additional visual aids. Left: Hangzhou Bay Bridge. Centre: Hong Kong-Zhuhai-Macau Bridge. Right: HKZM Bridge Map.
2.1 billion yuan = approximately £220m (using an exchange rate of roughly 9.5 yuan to £1.
Construction’s Baumol Cost Disease. This phenomenon (wages rising despite stagnant productivity) is known as Baumol cost disease. Contrast this with manufacturing’s hundred-fold productivity gains. Brian Potter at Construction Physics continues to explore this why this has happened in construction.
China Build Quality. Just this month, less than a year after completion, a landslide destroyed the Hongqi bridge in Sichuan.
China Worker Deaths. Compare this 2021 research: Analysis of the Characteristics of Fatal Accidents in the Construction Industry in China Based on Statistical Data
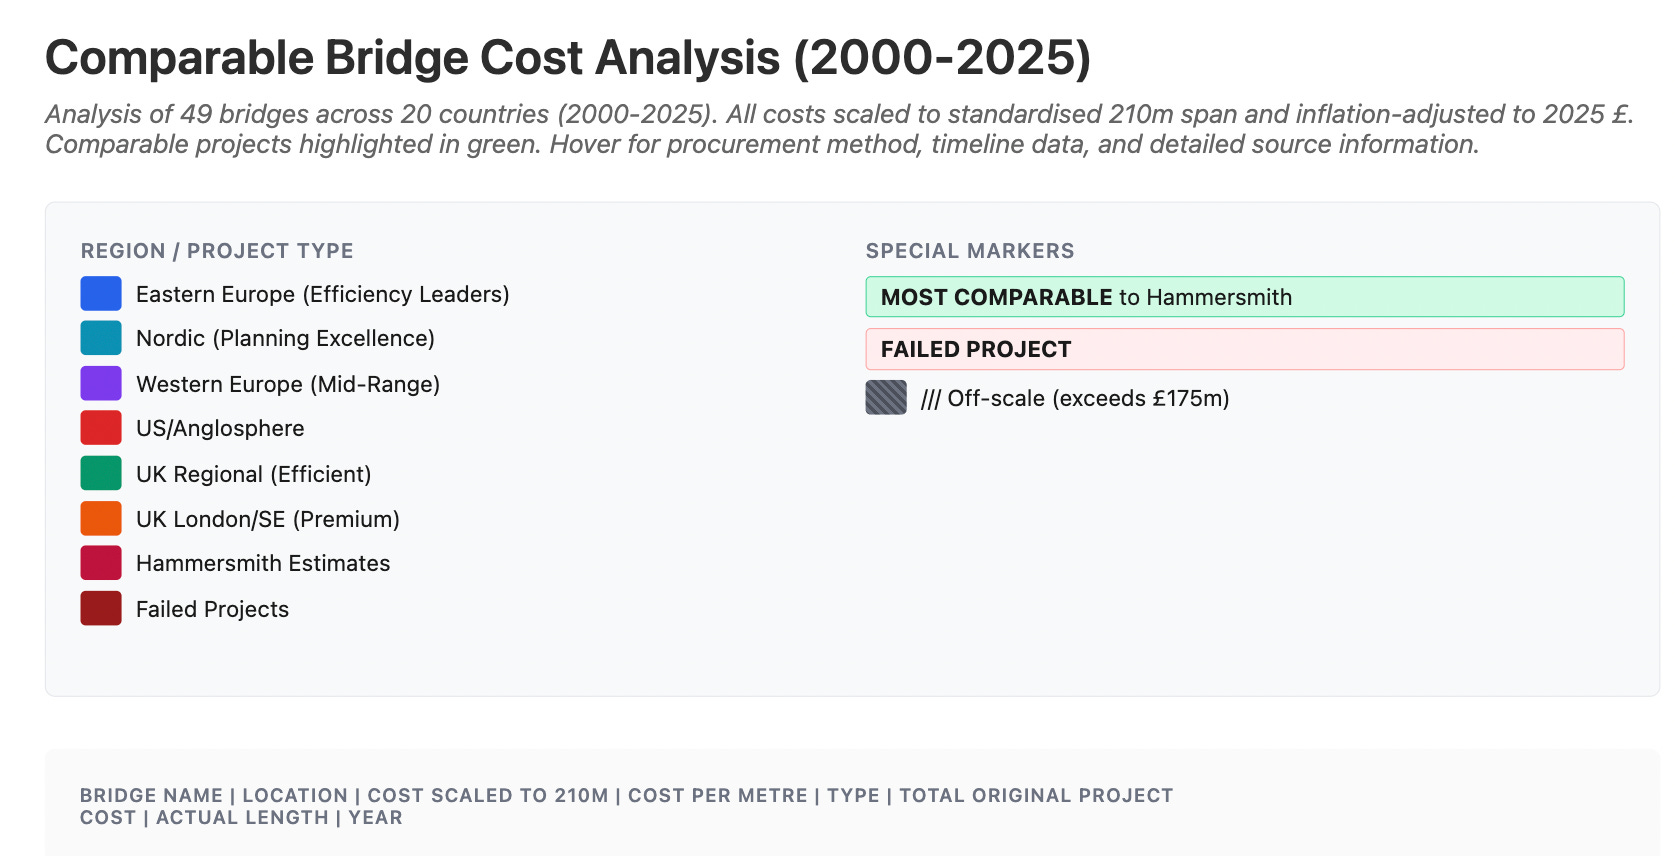
Estimating Demolition & Re-build Cost for Hammersmith Bridge. To estimate rebuild costs, I analysed demolition and reconstruction using sum-of-the-parts methodology (available here) and compared against international bridges and Thames crossings (use this link). Note: chart is interactive, best viewed on desktop browser (rendered as Claude Artefact).
Demolition & Rebuild Sum of the Parts: UK baseline costs suggest ~£160m. Reading across from other London projects implies ~£225m minimum.
Comparable Bridge Cost Analysis: I compiled 49 bridges across 20 countries, calculated cost per metre, and scaled to Hammersmith Bridge. Sample criteria:
Geography: OECD developed democracies with comparable regulatory environments, labour standards and engineering capabilities.
Period: 2000-2025 for current construction costs and regulatory requirements.
Type: Urban river crossings (150-300m span) similar to Hammersmith Bridge, plus larger projects to establish cost scaling patterns.
Sources: Official government records, parliamentary documents, engineering journals (New Civil Engineer, ENR), EU Cohesion Policy databases, audited accounts.
Nearly £300m has been spent on the Lower Thames Crossing’s mammoth 359,000 page planning application.
Officially the Sheephouse Wood Bat Mitigation Structure, a 1km structure in Buckinghamshire designed to protect a “rare” colony of Bechstein’s bats. The tunnel turned out not to protect the bats and it now appears that the bats are not in fact endangered.
Conway Planning Application. Source: LBHF Planning Portal:
“Variation of condition 6 (Transport and Storage) to amend the storage location from 191 Tunnel Ave, London, SE10 0GR to FM Conway, Asphalt Plant, 20 New Road Newhaven, BN9 0EH and condition 12 (Reinstatement timeframe) to extend the timescale for reinstatement and repainting of those elements of the bridge affected by the works by a further 5 years of planning application ref: 2022/01109/VLBC granted 6th June 2022.”
Braess’ Paradox. Here is a Royal Institution lecture delivered on Braess’ Paradox in 2008: Untangling the Web by Chris Bishop. Here is a paper co-authored by a friend on the subject: Coordinating the Crowd: Inducing Desirable Equilibria in Non-Cooperative Systems (Jan-2019): “Many real-world systems such as taxi systems, traffic networks and smart grids involve self-interested actors that perform individual tasks in a shared environment. However, in such systems, the self-interested behaviour of agents produces welfare inefficient and globally suboptimal outcomes that are detrimental to all - some common examples are congestion in traffic networks, “demand spikes for resources in electricity grids and over-extraction of environmental resources such as fisheries.”
Forced Experimentation. Larcom, S., Rauch, F., & Willems, T. (2017). “The Benefits of Forced Experimentation: Striking Evidence from the London Underground Network.” The Quarterly Journal of Economics, 132(4), 2019-2055. “The research analysed the February 2014 London Underground strike using Oyster card data. They found that about 5% (one in 20) of affected commuters permanently switched to their new route after the strike ended, and that the time saved in the long term by those who found better routes actually outweighed the time lost by all commuters during the strike itself.”
According data cited in a report from the Barnes Community Association. Analogous phenomena are observed elsewhere. Compare, for instance, Madrid.
Barnes Community Association, Hammersmith Bridge - the real impact of its closure on our community (March 2020).
The replacement 533 service remains unreliable. For residents who relied on their Freedom Pass to reach , the loss of convenient connectivity has been significant. Barnes railway stations lack step-free access and terminate at Waterloo without crossing the river.
Statutory Obligations: There are three statutory duties in particular worth considering.
Highways Act 1980: Legal duty to maintain highway assets including bridges “in a condition suitable for ordinary traffic” - but does not mandate restoring motorised vehicle capacity. The council has discharged this duty by stabilising the bridge for pedestrian and cycling use.
Traffic Management Act 2004 (Network Management Duty): Legal duty to manage network to reduce congestion (“secure expeditious movement of traffic”). As discussed in this piece, six years of closure has already demonstrated that 22,000 vehicle movements daily were not necessary for network function and the solution proposed in Part 3 would meet this obligation more effectively.
Equality Act 2010: Public Sector Equality Duty requires considering impacts on elderly and disabled residents. Six years of inaction disproportionately harms protected groups. Arguably, the Council’s most pressing legal obligation is to the Equality Act duty to consider the impacts on elderly and disabled who’ve lost accessibility for six years rather than to restoring vehicular capacity.
Precedents for Highway Designation Change: Bristol Bridge (B4053) and London Bridge (A3/A10) demonstrate that road classification need not change when restricting access – TROs regulate traffic independently of highway classification. Experimental TROs allow 18-month trials without pre-consultation, converting to permanent orders if successful. The six-week judicial review window after permanent orders provides rapid legal certainty. No Secretary of State approval would be required for this non-trunk road.
See Footnote 37: Statutory Obligations.
Pod Lane Detail:
Please refer to the report from Possible, the charity that originally proposed the solution for further details.
It is worth noting further details from their recommendations:
Two pods will be on charge and on reserve in case of faults so there are no interruptions in the service. They would be parked under the flyover in a lay-by ready to deploy if there’s issues with any of the others.
A pod should depart from each terminus every two to three minutes during peak times. They cannot run more frequently than this because the bridge itself is the bottleneck - the weight limit means that only one shuttle will be able to cross at a time, at the fairly low speed of 9.63 miles per hour.
Trams. Although I can find no further references, one archived website claims that: “In 1902 there were serious proposals to run a tram service over the bridge.” Source.
If you are interested in working on that challenge, please do consider joining Looking for Growth, Civic Future, and Anglofuturism. See also Works in Progress, Britain Remade, British Progress, and Re:State.
While we dwell on Britain’s missed opportunities to lead the world in chip manufacturing and AI research, are we missing the opportunity to lead the world in software-led distributed manufacturing or the technology for space colonisation?
Tucked away within that most excellent piece is an entirely different issue that the entire UK needs to address, sooner rather than later.
What is the purpose and goal of our listed building infrastructure and how should it operate?
As currently constituted English Heritage [and its companion bodies in the other nations] will eventually end up turning the entire nation into a theme park for American and other tourists; because eventually all buildings will be old enough to deserve a listing..
I speak to this as someone who lives in a G2 listed building and has done for more than 40 years. That building is in an entire street of such buildings, all designed by Nash and built by Cubbitt.
Do we need to protect the street's general look and feel? Probably. Do we need to prevent all meaningful and useful changes to the structures? Definitely not.
We're not allowed to alter the roof line. We're not allowed to change the railings outside to enplace waste/rubbish/recyling points. We're not allowed to change doorframes and windows, or use double glazing. We're not allowed to change the colour of the facade. We're not allowed ... the system is all about what we can not do and not at all about how buildings can be changed and adapted to suit modern needs and requirements.
Where planners are willing to engage with and address changing needs the entire process is excruciatingly slooooow.
A small example here: almost all of London's "Georgian" architecture is built from soft bricks made from local clays that were almost always underfired. So when exposed to the atmosphere they erode rapidly and badly. They're also so soft that a good swing with a heavy sledge hammer will smash right though two course walls in two or maybe three full swings. But if we want to stabilise these buildings which usually have no foundations, we're not usually allowed to replace the existing soft bricks with stronger items that won't collapse or erode.
This isn't future proofing, this is preserving in aspic. This isn't management of a dynamic urban environment. This is managing a living museum.
In the case of Hammersmith Bridge we now need to seriously ask what it is that we are protecting with its listing.
Assuming that we need a bridge there at all then why not simply tear it down and replace it with a modern properly designed structure that looks exactly the same? There's no law - natural or statutory - that says a new bridge has to look modern. Making it look and feel the same as the old bridge won't actually add significantly to the costs and will be far far simpler cheaper and faster than seeking to "renovate and repair".
Well done, Nick. This is an excellent piece of citizen research and writing. It’s making quite an impact and rightly so. You have brought together the various threads of the complicated story in a way that has been missing up to now with great thoroughness and wordcraft - thank you Charles.