


Inflation & Inflation Expectations
Is quantitative easing inflationary?

Today, on QE’s consequences, I’ll focus on inflation and ask:
What is inflation?
What are inflation expectations?
Was QE inflationary?
Will QT be deflationary?
Disclaimer: The usual disclaimers apply. All posts are solely my own opinion. As such, they should not be construed as investment advice, nor do the opinions expressed reflect the views of my employer.
Memes and money printers
Online communities have fairly comprehensively satirised monetary policymakers in recent years.
Here are two of the internet’s finest contributions to this cause:
Money Printer Go Brr
QE Explained by Bears
In their simplicity, these animations deliver a devastating blow and are, perhaps, the riposte par excellence to unconventional monetary policy.
The first video sits firmly within the satirical tradition, using exaggeration and puppetry to ridicule authority. Jerome Powell, the head of the Federal Reserve, is depicted endlessly cranking a ‘money printer’.
The latter, is as low budget as imaginable, two stock-animation bears with auto-generated voices sardonically laying waste to monetary policy decisions. Originally uploaded in 2010, the video has aged well. The bears engage in a Socratic dialectic exchange, in which the lead bear outlines several key arguments against quantitative easing.
For instance, the bear criticises the profits of the market makers who facilitate QE transactions (earning a fee every time a central bank conducts an asset purchase). Although this is a fair accusation, the video focuses in particular on Goldman Sachs and has undertones of conspiracy theory.
Let’s focus instead on the main criticism that both these videos launch at policymakers; namely, that QE has been inflationary.
QE & inflation
The claim that QE is inflationary should be totally uncontroversial, because that’s kind of the point, right?
In a prior instalment, we identified that central banks tend to foreground the purpose of QE as a tool for controlling the rate of inflation and maintaining monetary stability:
Quantitative easing is a tool central banks can use to meet an inflation target. The aim of quantitative easing is to inject money into the economy in order to revive nominal spending.
Bank of England, Quantitative Easing & Benford et al. (2009)
Just as a feature of interest rate cuts is that they are inflationary (while interest rate hikes are deflationary), a feature of QE should, in principle, be that it is inflationary (while QT is deflationary).
And yet, curiously, for a period of time prior to 2020, the inflationary consequences of QE were not apparent in the macroeconomic data. More on this below. But first, so that we are all on the same page, let’s step back and ask: what exactly is inflation?
Measuring inflation

In brief, inflation refers to an increase in the price level of goods and services in an economy (deflation is the opposite). For example, a 2% annual rate of inflation means that £100 today, although nominally still worth £100 next year, will only have the purchasing power of £98 next year in real terms.
At its root, inflation is driven by too much demand relative to supply. Increasing the supply of something will reduce its value, all else being equal.
How do we actually measure inflation, this change in price level of goods and services?
Typically, policymakers use a measure of consumer price inflation to assess the rate of change of prices (as in, a measure of consumers’ experience of inflation, rather than, say, industrial manufacturers’ experience of inflation).
In the UK, the most well-established set of inflation statistics are published by the Office for National Statistics (ONS).
Amongst market participants and commentators, the most widely used measures are the Retail Price Index (RPI) and Consumer Price Index (CPI), historically known as the Cost of Living Indices. There are also measures for manufacturers, a typical measure being the Producer Price Inflation (PPI). According to the ONS, the most reliable measure of consumer inflation is the Consumer Prices Index including Housing (CPIH).

To build the dataset from which these inflation measures are derived, every month the ONS sends out 300 people (‘price collectors’) into the field across 141 locations across the UK (and online) who quite literally ‘collect’ the prices of a predetermined ‘basket’ of items.
In the most recent edition of the consumer price basket, there were a total of 743 items with an average of 180,000 price points collected each month (full spreadsheet with the granular breakdown of constituent items available here). Additions to the most recent iteration of the basket included e-bikes, surveillance cameras, and frozen berries. Removals included digital cameras, spirit-based drinks, and non-chart CD albums bought in store.
How does the ONS decide for which items it should collect prices?
There is a careful methodology applied when constructing the representative basket of consumer items. The methodology takes inputs from sources of including the Living Costs and Food Survey, market research data, and trade journals. For anyone interested, the full price-collecting technical manual can be enjoyed here, outlining, amongst other things, methodologies for weighting index items, determining what locations to use, and assessing what constitutes a representative item.

The above flow diagram illustrates how a collected price is synthesised into the overall index basket, here the example is of the item termed ‘apples (dessert).
When looking at inflation statistics, be careful to identify whether the numbers have undergone a ‘seasonal adjustment’. These adjustments are often made by data collection agencies to remove systematic calendar-related variation associated seasonal effects which can obfuscate real underlying trends in the data. For example, oranges can be purchased year-round, but prices are significantly higher in the summer months when the major sources of supply are between harvests.
Another point to highlight is the difference between core inflation and headline inflation. Core inflation attempts to strip out volatile constituents like food and energy prices. Headlines leaves these items in, so is typically a more elevated figure.
Relatedly, see below for an interesting analysis of price inflation variation for English pints 2010-2023. The trends are themselves interesting, but perhaps most striking is the unusually high number of data points that are collected for pints by the ONS price collectors…

Inflation expectations
So, in the most literal sense, that is inflation - the cost of a basket of goods and services. In truth, however, inflation is an amorphous, ever-shifting phenomenon.
Although rooted in the physical world and driven by the surplus or lack of goods and services, inflation is a psychological experience that is shaped by our personal perceptions of reality and expectations for the future. The subjectivity of this phenomenon means that experiences of and expectations for inflation vary across society at any given point in time. Indeed, the data suggest that households’ perceptions and expectations of inflation are highly dispersed, often related to income distribution.
For instance, a consumer’s sense of the rate of inflation is inordinately driven by the price changes in items that they most frequently purchase, typically non-durable items such as food and personal care products that often experience higher rates of inflation.
Another psychological quirk of consumer inflation is that consumers tend to remember price increases more and disregard price declines. There are ways in which to quantify inflation expectations. If of interest, I offer an exploration of these in the Appendix 2.
That, more or less, is inflation.
Recent trends in inflation
So, where does inflation stand today?
Of late, inflation has been seen to increase significantly across the world. But, looking across markets today, it would appear that we are past the peak of the current inflationary cycle. That said, we may face structurally higher inflation above the 2% target rate for longer than expected. This persistently high inflation has paired itself with low unemployment, a historically rare occurrence which may be cause for further wariness (perhaps conditions for a wage-price inflationary spiral).
Here are several charts that visualise recent inflationary trends.
First, global rates of headline inflation by region and country (2021-present). This heat-map provides a snapshot of global inflation relative to central bank targets. Blue signifies an annual pace of headline inflation which is below target, white is at target and red is above target. The intensity of the colour defines the level of deviation versus the target rate.

Next, US consumer price inflation (2021-present). This heatmap is decomposed by component categories and the shading is intra-category relative to the two-year period shown.

Here is a longer time-series showing UK consumer price inflation rates (2013-present). UK inflation has been stickier than in comparable economies, remaining more elevated and increasingly an outlier:

Finally, here is an interesting dataset published by the Federal Reserve Bank of Atlanta that disaggregates the components of consumer price inflation to include only those that are ‘stickier’, more likely to become entrenched
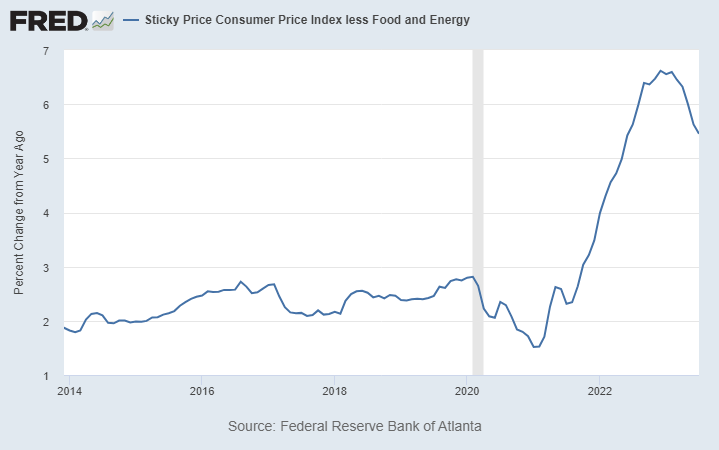
When is QE inflationary?
Now, on to the relationship between inflation and quantitative easing.
Did quantitative easing cause the recent inflationary cycle? Here’s the former economist of the Bank of England, Andy Haldane, answering that question earlier this month:
Sophy Ridge: Did the BoE print too much money and did that fuel inflation?
Andy Haldane: The BoE printed money longer than it needed too, with the benefit of hindsight. The greatest swathe of the easing was needed at the time of COVID to protect jobs, households, and businesses. Did we persist too long and step on brakes too late? I think regrettably that is where we find ourselves.
Sophy Ridge: In fairness, you did say that at the time. (Note: Andy Haldane was an outlier on the MPC, the only member to vote against additional quantitative easing bond purchases from August 2020).
Sky News Interview, 5th September 2023 (5:00-6:00)
As far as I am concerned this is the right answer. But let’s explore the evidence for this.

The graph above charts inflation (US CPI) against money supply (US M2). This chart would seem to indicate that the recent inflationary surge is potentially a function of money supply growth.
That may, however, be an overly simplistic interpretation of the data. After all, correlation does not equal causation. Indeed, Jerome Powell speaking to the United States House Committee on Financial Services, Session on the subject of ‘Monetary Policy and the State of the Economy’ in February 2021 took the other extreme view, that money supply is almost entirely inconsequential for inflation:
Representative Warren Davidson (R-OH-8): Does the printing of more US dollars somehow diminish the value of the dollars that other people hold?
Jerome Powell: There was a time when monetary aggregates were important determinants of inflation, that has not been the case for a long time. So, we see that the correlation between M2 and inflation is very low.
In reality, the truth is likely somewhere in between.
We considered previously how QE increases the money supply by creating reserves and adding it to the economy as digital bank money as it buys assets from the private sector.

Interestingly, the large money supply increases caused by the QE programmes of 2008-2010 did not appear to move the dial on inflation, which remained very low. The impact of QE on interest rates and yields therefore appear to vary depending on the broader macroeconomic conditions in which it is implemented (state contingency):
If the effect of QE on yields is uncertain and time-varying, then the impact of QE on the real economy and ultimately on CPI inflation (which the MPC targets) is, unsurprisingly, also both uncertain and likely to vary over time.
Huw Pill, Bank of England MPC
State contingency seems a fairly reasonable explanation. For instance, one difference in the latest round of QE versus prior rounds was that it was paired with fiscal stimulus in response to the COVID-19 pandemic:
Direct cash payments to individuals and businesses in 2020 and 2021, which totalled more than $5 trillion, along with the rapid growth of base money—under the Fed’s large‐scale asset purchase program have combined with global supply‐chain disruptions to generate inflation rates that are substantially above the Fed’s long‐run goal of 2 percent.
George Selgin, The Menace of Fiscal QE
Why would this particular combination of conditions engender a more inflationary outcome? Economist Kenneth Rogoff offered the following analysis to the House of Lords committee exploring that question:
First, I underscore the difference between fiscal QE and pure QE. When the financial crisis in 2008 happened, interest rates were not yet zero. People thought they would go back up again and QE sent important signals about what the central bank was thinking. That is much less true today because people just think that interest rates will not go up for a very long time, no matter what the central bank says.
Kenneth Rogoff, House of Lords, Select Committee on Economic Affairs, March 2021
Similarly, here bond manager Richard Woolnough offers a perspective on why latter rounds of QE would have had different outcomes:
Is money supply growth inflationary or not? One way of squaring the circle of early vs late QE would be to analyse where the printed money went. During early QE, it simply filled the bank vaults to make banks solvent against depositor runs, and paid for previous lending mistakes, refilling the reservoir due to the drying up of financial markets. The later stages of QE resulted in cash overflowing from banks into the real economy, and therefore brought about inflationary consequences.
Richard Woolnough, Bond Vigilantes
So, in this reading of QE, when used in earlier phases to shore up market instability, the printed reserves did not make it into the real economy and were an effective short term solution. By contrast, when QE was used later in tandem with fiscal stimulus, it caused a dramatic growth in the money supply that spilled beyond financial asset prices and into the real economy, generating broad-based inflation of goods and services
The counter-argument to this is strong too and foes along the lines of: inflation was solely the result of excessively loose fiscal policy and global supply chain issues compounded by a huge systemic energy shock.
My response to this is that both the inflationary shocks and monetary policy decisions contributed to the Great Inflation of 2022. Quantitative easing is inflationary, but it was only when deflationary tailwinds generated by globalisation fell away that the inflationary effects of quantitative easing became visible and entrenched.
Closing thoughts: QT & deflation?
To bring this discussion to a close, here is a final thought on quantitative tightening and deflation.

Given that the most recent cycle of quantitative easing appears to have stoked inflation, will the current monetary policy of quantitative tightening be deflationary?
The current the rate of quantitative tightening (the opposite of QE, akin to money destruction or monetary cancellation) is historically unprecedented.
The potential risk that lies ahead here is that QT proves to be a far more potent deflationary force in the economy than policymakers and economists have anticipated. In my view, this remains a tail risk that may lead to further surprises in the path of future inflation.
Thank you for reading. As always, feel free to reply if you have comments, questions or suggestions.
Bibliography
Office for National Statistics
Consumer Prices Indices Technical Manual, 2019, ONS
Introducing the New CPIH Measure of Consumer Price Inflation, ONS
Changes to National Accounts: Imputed Rental, ONS
Bank of England:
Understanding Inflation: Expectations and Reality, July 2019, Silvana Tenreyro, BOE
Financial Times:
Did QE cause inflation? FT Unhedged, July 2022
Bond Vigilantes:
Cancel Culture – A New Monetary Phenomena. Richard Woolnough, Bond Vigilantes, May 2023
Other Sources:
The Federal Reserve Bank of New York, Survey of Consumer Expectations
What are inflation expectations? Why do they matter? Brookings
On inflation and inflation expectations, Kaiser Partners
Economic & Market Update, Q3 2023, JP Morgan Asset Management
Asset price inflation is not a thing, Matt Yglesias, March 2021, Slow Boring
Inflation: Perception vs. Reality, Farina Adam Khong & Loke Po Ling, Monetary Policy Department, Bank Negara Malaysia. May 2017
The pass-through from inflation perceptions to inflation expectations, September 2022, Stefanie J. Huber, Daria Minina & Tobias Schmidt, BIS
Expectations of Inflation: The Biasing Effect of Thoughts about Specific Prices. de Bruin, Van der Klaauw & Topa (2011) Journal of Economic Psychology.
Appendix 1: Some inflation jargon busting
Disinflation is a temporary slowings of the pace of price inflation
Hyperinflation describes very high and accelerating inflation.
Reflation is the return of prices to a previous rate of inflation.
Stagflation is the simultaneous appearance in an economy of slow growth, high unemployment, and rising prices
Appendix 2: Measuring inflation expectations
There are several ways in which market participants estimate inflation expectations.
Most notably, there are market-implied indicators, in other words, indicators that are created by the trading patterns of market participants, such as the 5Y/5Y Inflation Swap Rate (which measures the expected inflation rate over the five-year period that begins five years from today).
Elsewhere, surveys are used to determine inflation expectations, like the University of Michigan's monthly Survey of Consumers and the Philadelphia Fed Survey of Professional Forecasters.
Alternatively, some practitioners construct composite indices, like the Index of Common Inflation Expectations. There are more idiosyncratic measures available too, for instance, the World Container Index (measured in USD per 40ft container) that can be a guide to inflation trends in supply chains.
Appendix 3: Housing Inflation
How do we account for shelter and housing in inflation?
Another key variable is shelter and housing costs. In standard CPI measurements, shelter is accounted for through the cost of renting rather than the cost of buying a house. The way CPI sees it, housing is a service and everyone who isn’t experiencing homelessness is purchasing that service from a landlord. If you happen to be your own tenant then that is an interesting fact about you, but it does not change the economic picture.
This is not representative of reality for the majority of people in the UK. Approximately 35% of the 25,000,000 dwellings in the UK are owned outright (owner-occupied housing). Likewise, 19% of dwellings are private rental, 17% are social housing and about 30% are owned with a mortgage currently (vs. 43% in 1992).
That is where CPIH, the UK Statistical Authority’s preferred measure of inflation, comes in to play. CPIH seeks to correct for this by accounting for owner occupiers’ housing costs. These are the costs associated with owning, maintaining and living in a home. For many owner occupiers the biggest housing cost is the mortgage payment, other costs include dwelling insurance, estate agents’ fees and maintenance and/or renovation costs. These costs are a significant expense for many households and account for approximately ten per cent of total household expenditure. CPIH uses an approach called rental equivalence to measure OOH. Rental equivalence uses the rent paid for an equivalent house in the private sector as a proxy for the costs faced by an owner occupier. In other words this answers the question “how much would I have to pay in rent to live in a home like mine?” for an owner occupier.
So back to housing. If you get a 2% raise but your rent goes up 7%, that’s bad. That’s inflation. Your real living standards are falling rather than rising. By contrast, if you get a 2% raise but the value of your house goes up 7%, that’s good. In fact, you’re not likely to say “but” the value of your house went up; you’ll say and the value of your house went up. Not only did your income rise, but your net worth rose, too!
UK CPI/CPIH constituents. Only additional items in CPIH are Owner-Occupiers’ Housing Costs and Council Taxes:
