This instalment explores another financial theme; the public finances of the United Kingdom and the impact of monetary policy on government debt interest costs.
Disclaimer: The usual disclaimers apply. All posts are solely my own opinion. As such, they should not be construed as investment advice, nor do the opinions expressed reflect the views of my employer.
Treasury Lords Minister Baroness Penn at HM Treasury. Source: National Archives
The public finances may not be of interest to all readers, so please feel free to return again next week if this is not up your street. For those of you who choose to remain, I’ll let you in on a secret…
Over the past month, I have spent significant swathes of my free time exploring the UK’s public finances, trawling through some of the datasets freely accessible in the public domain. Rest assured, I greatly enjoyed myself throughout the process.
Why, you may ask? Well, I have two underlying motivations. First, as a UK taxpayer, I would like to understand more about how my taxes are used. Second, as someone with a natural tendency towards fiscal conservatism, I would like to know the answer to the question: how much debt is too much debt?1
In other words, is there a limit to how much debt the United Kingdom can sustainably issue and service?
The present piece will explore questions of fiscal policy and debt sustainability by examining the following themes in broad, artless brushstrokes (and at a level that treads the line between succinct and redundant):
How does the UK government raise revenues?
How does the UK government spend public money?
How does the UK government raise capital?
Why have UK government debt interest costs soared?
Is the level of UK government debt sustainable?
Before we dive in, please be warned that this piece is protracted and riddled with fiscal figures.
Caveat emptor and let’s begin!
Note on data visualisations: I have produced several of the charts in this piece using Datawrapper, a free web-based data visualisation toolkit. Datawrapper lets me visualise the charts interactively and embed them into this site. Datawrapper also embeds the data into the chart itself, so you can download and manipulate it too.
Note on fiscal figures: The figures and statistics used throughout this piece are taken from several sources. Historical figures are taken either as at end of August 2023 or as at end of December 2022 and are consistent with ONS or Bank of England official calculations. Forecast numbers are as at end of March 2023 and are consistent with IFS or OBR economic and fiscal outlooks. If you notice inconsistencies between charts, this may be the reason. If not, do let me know.
Note on sources: Principally, I have made use of resources provided by the below independent bodies (detailed at length in Appendix 1). These independent organisations diligently collect, publish, and audit vast quantities of fiscal information. Although I have been familiar with their work for some years, my admiration for them increases each time that I have a reason to engage with their work further.
Perhaps the most appropriate place to begin this exploration is to consider how the government funds itself.
There are two ways that the UK government can finance its public spending:
Through taxation and government assets;
Through the sale of government debt.
The nature of taxation
Before describing the types taxation and other receipts collected in the UK, let’s begin by reflecting briefly on the nature of taxation.
A tax system is not a state of nature; rather, it is a political philosophy expressed in numbers. Taxes are powerful drivers of human and corporate behaviour and have the potential to shape our society in dramatic and unforeseen ways.
To cite an arbitrary example, consider the long and expensive court cases that have been fought over whether Jaffa Cakes and Flapjacks are cakes (not generally subject to Value-Added Tax) or biscuits (often subject to VAT, especially if covered in chocolate).
In the UK, over the last few centuries, our system of taxation has evolved out of political struggles, wars, and good old-fashioned parliamentary debate. The resulting body of legislation is a tangle of received moral intuitions and conflicting principles. “The tax system rests on changing and inchoate, but deep-seated, normative assumptions”.2
The Outline of History, H.G. Wells, p.195 (1920). Source: Internet Archive
The size of the UK government receipts
In 2023–24, UK government revenue is forecast to total £1.058 trillion. This figure is equivalent to £37,000 per household (Source: IFS & OBR).
This vast sum is difficult to conceptualise. One way to help contextualise the number is to compare it with the UK’s gross domestic product (GDP). As a reminder, GDP is the value of all goods and services that are expected to be produced in the UK during the same time period.3
In 2023-24, UK government revenue is forecast to be 41% of GDP. We will, in turn, return to spending, the deficit, and total public debt. For now, I offer an overview of these figures, illustrated as a % of GDP as forecast for 2023-24. For context, I have also added a historical chart showing GDP numbers since 1992 (adjusted for inflation).4
Let’s examine the component parts of that revenue figure, the £1.058 trillion.
Note: The chart above illustrates the component parts of government revenues in pie chart form as a % of GDP, while the stacked bar chart below displays the same components as absolute £bn figures. All numbers relate to the 2023-24 tax year, the former are taken from IFS forecasts and the latter from OBR forecasts, all as at March 2023.
The composition of UK government receipts
According to the forecast, the largest single line-item contributors to UK government revenues in 2023-24 will be:
Income tax;
National insurance contributions (NICs); and
Value-added tax.
In the UK, government income consists primarily of tax revenues, which represent over 90% of the total receipts in 2023-24.
Income tax and national insurance contributions are together expected to raise around £440 billion. It is worth noting that only 60% of UK households pay income tax and that of those income taxpayers, the top 10% of earners contribute over 60% of total income tax receipts.
Value-added tax (VAT) is the next most important, forecast to raise £162 billion. Other significant tax receipts include corporation tax, council tax, business rates, and fuel duty. There are many more other lesser tax items that can vary significantly year-to-year. For instance, consider last year’s one-off energy profit windfall tax, which may raise as much as £7 billion over the next four years.5 There is further discussion of specific tax revenue line items in Appendix 4.
Besides tax items, there are various other receipts, miscellaneous non-tax revenues that account for around £107 billion of government revenue. These include income received by government from public corporations (for example, from local authority housing) and interest payments on government assets (such as student loans and foreign exchange reserves). Other non-tax revenue sources include the profits of state-owned industry, such as North Sea oil revenues.
In this fiscal year, several key taxes are forecast to rise more quickly than the growth of the economy as a whole. In the case of income tax, this is driven by the fact that, despite rampant inflation and the associated salary growth, the government have frozen tax thresholds. This leads to a phenomenon termed fiscal drag, where individuals and businesses find themselves pulled into higher tax brackets despite not seeing any wage growth in real, inflation-adjusted terms. Corporation tax is also forecast to rise as temporary capital allowances end. By contrast, some tax receipts are expected to fall, for example, tobacco duty (because people are smoking less).
By the 2027-28 tax year, annual tax receipts are forecast to reach 42%of GDP. This will be an historic high-water mark for the tax rate that has not been matched since the end of the Second World War.6
The rise in taxes in recent years has been almost unprecedented. For reference, at the time of the last general election, UK tax revenues amounted to just 33% of GDP, nearer the long-term historical average of the last 100 years.7
The UK’s annual revenues may appear vast, but the government spends even greater sums of money each year on behalf of the public than it raises through taxation, even when taxation is more than 40% of GDP.
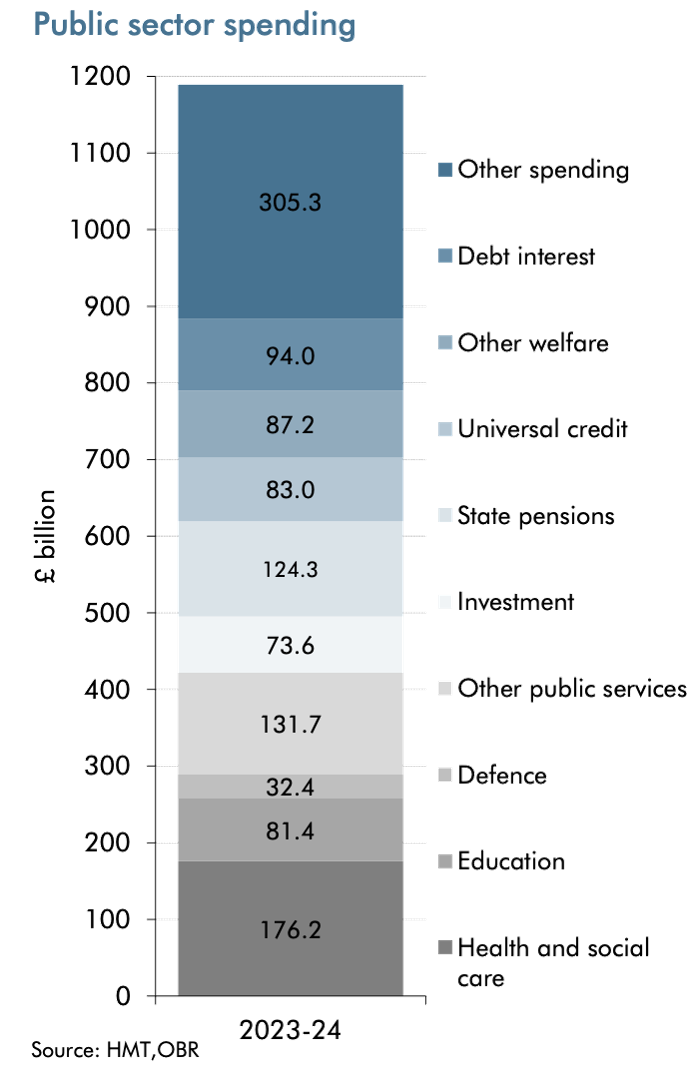
In 2023-24 UK government spending is forecast to be 46% of GDP (5% greater than revenues). In absolute terms, this is £1.189 trillion of spending in aggregate which is equivalent to around £42,000 per household.
Note: The chart above illustrates the component parts of government revenues in pie chart form as a % of GDP (note that these numbers are actual historical 2019-20 figures, whereas revenue numbers were forecast projections). The stacked bar chart below displays the components as absolute £bn figures (note that these figures refer to 2023-24 tax year and are taken from IFS forecasts as at March 2023).
For reference, the total spend of £1.189 trillion compares to a pre-pandemic level in 2019−20 of £890 billion, equivalent to about 40% of GDP at the time (vs. 46% now). That 40% rate was much closer to the average for the post-war period. Following the onset of the pandemic, however, spending has spiked sharply.
The composition of UK public spending
Let’s examine the component parts of that spending figure, the £1.189 trillion.
According to forecasts, the largest single line-item contributors to UK government spending in 2023-24 will be:
Social security (of which, largest: state pension; universal credit);
Health and social care; and
Debt interest costs.
In the UK, until more recently, the primary function of taxation was to pay for the country's defence, transport systems, education, and other government services.
Today, taxes are overwhelmingly used to fund public healthcare and social security. By far the single largest area of public spend is cash transfers through the welfare system, expected to cost £294.5 billion in 2023-24, roughly a quarter of total public spending. Of that, 51% of welfare spending is paid to pensioners alone, with state pensions the largest item at an expected £124.3 billion. Other large items include universal credit (and the tax credits and benefits it is replacing) at £83.0 billion and disability benefits at £35.3 billion (around two-thirds paid to people of working age).
Punch cartoon, illustrative of Edwardian conservative attitudes - plus ça change. Source: Punch, 1907
The next largest area of public spend is health and social care.
Healthcare spending has doubled in size as a proportion of total spending since the 1990s, going from roughly 10% to nearly 20% of total government spending. The growth in these areas of spending of welfare and health has been at the expense of all other areas of government spending, whether that be education, defence, or transportation.
Most intriguingly of all, the third largest area of public spending is now debt interest costs, the cost of servicing the interest payable on outstanding government debt.
Given that we have just lived through a period of the lowest interest rates in human history, this is really rather surprising and testament to both the scale of our national debt and suggests a failure of efficient debt management. We will return to this shortly to find out how exactly that has happened.
How does the UK government raise capital?
Gatekeeper, Bank of England, John Hogan, 1892. Source: Bank of England
Budget surpluses and deficits
Each year, the Chancellor of the Exchequer presents a Budget. The Budget is a statement to the House of Commons outlining the state of the economy and the Government's proposals for changes to taxation. The House of Commons debates the Budget and scrutinises the subsequent Finance Bill, which enacts the Chancellor's proposals.
The current Chancellor of the Exchequer presented the most recent Spring Budget to Parliament on 15th March 2023. The next statement that the Chancellor will present will be the Autumn Statement scheduled for 22nd November 2023.
We have already established that, in the majority of years, the UK government spends more than it makes. This difference, the gap between the receipt revenues and the public spending, is known as a budget deficit.
Occasionally, but only very occasionally, there is a year where the government spends less than it earns in receipts. This is known as a budget surplus. The last time that the UK enjoyed a budget surplus was in the 2001-02 fiscal year, when Gordon Brown was Chancellor. The chart below illustrates an annual time series of budget data since 1948 (surplus years highlighted in yellow).
When the spending of the UK government exceeds its income,we might compare the government to an individual who has spent all their monthly salary but still has expenses due. As a result, they go into their overdraft.
Like an individual, who could use a form of borrowing to bridge this gap, such as a credit card, the government must make up the difference between these flows with some form of borrowing.
However, unlike an individual who is deep in their overdraft, and may be subject to punitive and spiralling interest payments, the UK government is an AA-rated sovereign issuer. That means that it is able to borrow money over different time horizons from a vast range of investors through deep money and capital markets. It is for this reason that comparisons between public and household finances are generally quite misleading.
Moreover, generally speaking UK government borrowing can be done at a rather favourable rate in comparison to other sovereign issuers (and certainly relative to corporate issuers and individual debtors taking out credit cards). This is due to the long-established creditworthiness of the UK, perhaps best evidenced by the fact that the UK has not failed to meet its debt obligations since the Great Stop of the Exchequer of 1672.8
The UK government’s borrowing rate was especially favourable during the late 2010s. This fact is illustrated in the above chart which plots the yield of the UK 10-year bond. This yield figure approximates the interest rate that the UK government would have to pay an investor for the privilege of borrowing money for a period of 10 years.
In 2020, this figure fell to an all-time low of just 0.12%. In effect, borrowing was almost free. Today, the 10-year yield is back above 4.60%, much closer to the long-term historical average.
In fact, the period prior to and during 2020-2022 saw what are likely to have been the lowest interest rates ever recorded in human history. Even at the time, investors and observers recognised that it was an extraordinary period.
In October 2019, when roughly 25% of the global debt market was trading below a 0% yield, levels once thought improbable, the FT published a series called Negative Yields: Through the Looking Glass.
Negative yields remain a remarkable phenomenon. The dissonance and incongruity of bond markets at that time is eloquently summarised by the FT’s Tommy Stubbington, who wrote in 2019:
Bonds worth $15 trillion — roughly a quarter of the debt issued by governments and companies around the world — are currently trading with negative yields. That means prices are so high that investors are certain to get back less than they paid, via interest and principal, if they hold the bond to maturity. They are, in effect, paying someone to look after their money.
That period is already fondly remembered as the ZIRP era (zero interest rate policy era). Admittedly, many of the festival of curiosities and marvels that ZIRP produced still linger with us today. They range from meme stocks, to high-multiple VC investments, NFTs, and cryptocurrencies. We even saw unusual spectacles in the bond markets, such as the issuance of 100-year bonds. FT again:
A few years ago, in the halcyon era of ZIRP, there was a mini-trend for “century bonds”. Even Oxford university got into the act. But the two most high-profile 100-year bonds were issued by Austria and Argentina.
From its peak, the 100-year Austrian bond has more than halved in value…
Here’s a chart of the price of the Austrian 2117s:
That’s an almost 40% loss in price since inception. The miserly semi-annual 2.1% coupon payments helps only a little, crimping the total loss is 31.27%, according to Bloomberg data. If you were unlucky/foolish enough to buy the Austrian century bond at its peak price/record low yield in 2020 then you’re looking at close to a 75% loss.
It all appears to be over now. Bloomberg pronounced ZIRP officially dead this month, a month that saw the worst US government bond sell-off since 1787.
Esteemed commentator Dr Parik Patel offered this perspective:
To return from that tangent back to the main point about net borrowing, we could summarise as follows: in most years the government spends more than it makes; to bridge the gap, the government finances the deficit by borrowing money; as a result, the total debt grows incrementally each year.
On a cash basis, the difference between government spending and income is known as the net cash requirement. The UK government finances the net cash requirement, as in, borrows money, by selling financial instruments like government bonds. This borrowing is recorded as public net borrowing.9
The above chart plots public net borrowing in a quarterly time series. Note, in particular, the dramatic spike in borrowing during 2020. That, unsurprisingly, reflects the spending related to the COVID-19 pandemic which includes, for instance, emergency healthcare sector costs and the COVID Job Retention Scheme.10
The size of UK government debt
So what is the total value of the UK government debt that is currently owed by the UK to its creditors? The short answer is: rather a lot!
To be precise, public sector net debt (PSND ex) was £2.594 trillion as at the end of August 2023 and was provisionally estimated at around 98.8%of GDP.
Earlier this year, net debt actually reached £2.6 trillion (as of the end of May), estimated at 100.1% of gross domestic product (GDP). This was the first time the ratio of debt to GDP has risen above 100% since March 1961.
Let’s examine the component parts of that total net debt figure, the £2.594trillion. Note that this data is as at September 2022, so does not take into account recent quantitative tightening.
The composition of UK government debt
Over 85% of the Government’s total debt has been raised by selling government bonds at auction. This represents £2.4 trillion of the total £2.7 trillion gross debt.
Who exactly finances this UK debt by buying government securities?
Holders of UK government debt securities encompass a broad range of investors including UK banks (£930 billion), other institutional investors (£635 billion), UK individual retail investors (£215 billion), and foreign governments (£620 billion).
Conventional gilts. These bonds pay a fixed coupon on a semi-annual basis. On average, gilts have a maturity date 14 years in the future (2037).
Index-linked gilts. These bonds pay a variable coupon that changes based on an inflation index (the UK Retail Prices Index) on a semi-annual basis. On average, linkers have a maturity date 18 years in the future (2041)
Treasury bills. These are zero-coupon bonds that are issued below par and redeem at par. On average, bills have a maturity date 6 months in the future (2024).
Gilts and bills are auctioned by the Debt Management Office (DMO) on a pre-determined schedule to market makers known as Gilt-Edged Market Makers (GEMMs) who then offer those securities in the secondary market, trade-able on the London Stock Exchange.
In return for the right to borrow this money, the government agrees to two obligations:
To pay back the principal par value of the bond at a maturity date in the future. This maturity date is typically 10 years in the future. This means that, this year, bonds issued ten years ago will mature and the government has to pay back the par value of that borrowed money. Alternatively, however, instead of paying off the debt, the government may issue even more bonds to roll over that same debt without paying it off. This means that the stock of debt changes in two ways: the government’s new borrowing is added and old maturing debt is rolled over.
To pay the bondholders coupon payments, the interest on the debt. On numerous prior occasions, I have subjected my readers to primers on interest rates, bonds, and monetary policy (for which, see below), so I will save revisiting that cruel torture upon any of you again. But the key point is that, this coupon payment is one and the same as the aforementioned debt interest costs.
Just under 10% is from National Savings and Investments (NS&I), representing £210 billion of debt. NS&I is the government-owned savings bank. It offers savings products, such as premium bonds and savings certificates to the public.
Other sources of borrowing make up the remaining 5%. This balance of roughly £75 billion comprises £25 billion in Network Rail loans, £15 billion in local authority external debt and £35 billion in other sterling and foreign currency debt.
Monetary policy & debt interest costs
We have now roughly covered the first three questions that I posed:
How does the UK government raise revenues? Through taxation and other receipts.
How does the UK government spend public money? Mostly on social security, health, and debt interest costs.
How does the UK raise capital? Through the sale of government debt.
Next, I want to focus in on one specific area of the public finances that I believe is not widely scrutinised outside of economic circles. This is despite the fact that it is one part of public spending that is well within our control; namely, debt interest costs:
Why have UK government debt interest costs soared?
The interest rate sensitivity (duration) of UK government debt
To any bond aficionados reading, these next few paragraphs may seem superfluous, but I have decided to lay out these points laboriously since, for those readers who perhaps do not spend their lives staring at the bond markets, they may not be obvious.
For bond maths reasons (namely, interest rate duration and the present value of future cash flows), when interest rates are rising, very long-date maturities like the 14-year gilts are great news for the Treasury but bad news for bondholders. That is because higher interest rates (usually driven by higher inflation) cause the present value of the future coupon payments to decrease, leading to a fall in the price of the bonds. Because the bonds are long-dated, the Treasury can continue paying lower interest, while bondholders are left with a loss.
Conversely, 18-year linkers arebad news for the Treasury and good news for bondholders. Despite their long-dated maturities, the coupon payments are linked to the increase in inflation, which means investors are compensated for par value losses with higher coupons. Those higher coupons mean higher debt interest costs for the Treasury.
Bills, meanwhile, are refinanced on average every 6 months. In an increasing interest rate environment, this is bad news for the Treasury, as debt interest costs will increase semi-annually when the coupon paid resets to the prevailing interest rate. The opposite is true in a falling interest rate environment, when the short duration will be good news for the Treasury.
There is a final form of quasi-government debt that is not issued by the Treasury itself. These are the deposits held by qualified institutions at the Bank of England in the form of reserves. These reserves have an overnight rate of interest. That is the lowest possible duration asset. In a period of increasing interest rates, this is disastrous news for the Treasury, as overnight rates quite literally refinance every day at the new higher rates in lockstep with the Bank of England’s Base Rate.
How the interest rate sensitivity of UK government debt increased
As explained in my quantitative easing primer, each time a QE transaction was conducted, a long-term fixed rate government bond was effectively swapped for an overnight reserve at the Bank of England. Crucially, these assets held in the Bank’s Asset Purchase Facility are indemnified by the government against any losses. Broadly, these cash flow arrangements were established by the Deed of Indemnity (for which, see Appendix 3).
What does QE mean for debt interest costs?
Well, whereas the Treasury would have benefited from lower interest rate costs on the long-term debt, instead it is now exposed to higher overnight interest rates.11
The exposure to overnight reserves is illustrated starkly in the chart above from the ICAEW in which, after holders of British government securities, the next largest public sector borrower is the Bank of England, which owes around £1,060 billion to its depositors.
A portion of these reserves existed prior to the current cycle of quantitative easing, but the vast majority of that figure represents the overnight reserve deposits created by the Bank’s quantitative easing programme to support the economy, in the order of £850 billion to finance fixed-interest gilt purchases, £20 billion to finance corporate bond purchases and around £190 billion to finance Term Funding Scheme loans.
That means that we are left in a surreal situation where, despite the successful efforts of HM Treasury’s Debt Management Office to lock in fixed interest rates for long periods, the UK government has once again become highly exposed to rising interest rates and inflation.
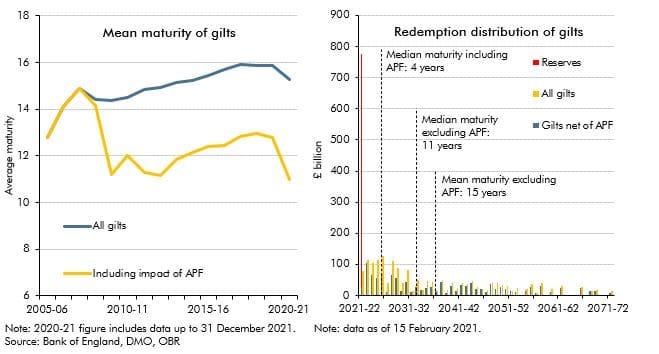
In theory, the average maturity of government bonds issued by the UK government is longer than the average maturity of government debt in most other advanced economies (with a median maturity of 11 years). In practice, however, when you include the Bank of England’s liabilities in the calculation, the average maturity of government debt has shortened considerably (with a median maturity of 4 years). This is almost exclusively due to large-scale gilt purchases by the Bank of England, via its Asset Purchase Facility, as part of its quantitative easing operations.
In effect, by enacting the programme of quantitative easing, the Bank of England swapped a significant proportion of government debt from fixed-rate gilts into variable rate central bank deposits. This is best illustrated in the below pair of charts published by the OBR.
The result is that, today, the majority of public debt is exposed either to changes in interest rates or, in the case of index-linked gilts, to changes in retail price inflation, driving interest costs higher and higher each time inflation increases and the Bank of England raises its benchmark central bank deposit rate. In more precise terms, this means that today 59% of the government’s debt liabilities respond to interest rate changes over the forecast period. The equivalent figure would have been 44% prior to the start of the QE programme in 2009 when debt levels were also much lower.
Look, we all knew it would come to this eventually. I dissembled with musings on the tax system, I equivocated with bond facts, and I offered you treats in the form of fiscal numbers. In truth, it was all a guise.
Once again, we find ourselves staring directly into the face of our old friend - quantitative easing!
“And I would’ve gotten away with it too!” Source: Author
Why is the tax burden so high? Why is the education budget so low? And why are NHS workers on strike?
We could reasonably debate back and forth any number of possible causes of these problems, but there is one factor that I now feel confident enough to cite unequivocally as being a direct contributor to all of these issues - quantitative easing.
When interest rates were at their lowest in 5,000 years of human history, we successfully financed our long-term debt sustainably, at all-time low rates of interest. Then, just as inflation took off and interest rates began to skyrocket, the Bank of England continued to switch a large proportion of our debt from paying fixed to paying floating interest through quantitative easing. Over the course of several programmes of QE, the Bank more than doubled the sensitivity of our national debt stack to increases in interest rates. In my view, this is nothing short of madness.
“Madness? This is QE!” Pictured: The Bank of England replaces the Debt Management Office’s gilts with overnight reserves. Source: Author
Active quantitative tightening
Governor of the Bank of England, Andrew Bailey. Source: Getty via BBC
Now look, clearly it is always going to be easier for me to spot and disparage a central bank’s error retrospectively.
With the benefit of hindsight, I can comfortably provide an armchair commentary, but in the heat of the moment, it is far more difficult for policymakers to take tough decisions that will appropriately account for every possible malign outcome.
Compare, for instance, Silicon Valley Bank, the US regional bank that collapsed earlier this year as a result of making a very similar error; namely, a massive interest rate bet in the wrong direction (for which, see Matt Levine, Startup Bank Had a Startup Bank Run).
Given the set of assumptions that the management team there had, perhaps that bet was reasonable? It is only now, in retrospect, that their failure to hedge interest rate exposures appropriately has become quite so obvious.
So, perhaps we can forgive the Bank for this policy error? Perhaps the error is in pursuit of a higher goal? I might personally feel that QE was harmful for a variety of reasons (as I have outlined in several prior pieces about QE fuelling inflation and inequality), but there are plenty of people who maintain that QE was a splendid idea. They may now concede that it does have some inconvenient side-effects, such as enormous costs for taxpayers, but undoubtedly, most QE advocates are far more intelligent and experienced than me (the rest are Modern Monetary Theorists).12 So let’s assume that they are correct and that I am wrong.
The next policy error
Yet, even setting aside all the relative merits and demerits of QE, that does not exonerate the Bank from a worse blunder.
Right now, in October 2023, I am of the opinion that the Bank of England is doubling down on their error and compounding their loss. That loss is not just theirs, but ours. That policy error is active quantitative tightening.
Today, the Bank of England is reversing the programme of quantitative easing by selling its stock of fixed-interest gilts back into the market. But this actually makes matters worse, because it means realising, crystallising, the loss on the securities. Rather than holding them to maturity and redeeming at par (passive quantitative tightening), the Bank is actively selling them at discount back to the market (active quantitative tightening).
This seems, to me, an extraordinarily daft waste of money.
Unlike Silicon Valley Bank, which was brought down by a liquidity crisis precipitated by a bank run, central banks are not exposed to the same risk of a bank run. This is because central banks can, in principle, hold all their securities until maturity and do not have to match the maturity profile of their liabilities to their assets. Instead of realising a face-value loss as a result of a liquidity crisis, central banks can hold the securities until they redeem at par. And yet, the Bank of England has surrendered this one competitive advantage by initiating a programme of active quantitative tightening.
For example, through QE, the Bank bought £22.4 billion in face value of the September 2034 gilt (ISIN: GB00B52WS153) with a coupon of 4½ percent. The average price paid during APF purchases was 37% above par.13 The bond today is trading at a price of about 102 which is roughly 25% below the average price paid. Now, through QT, the Bank are selling that bond back to the market at a loss. If they were to simply hold the bond until 2034, it would redeem at par value. (H/t Chris Marsh).
Why are the Bank doing active QT?
Why are the Bank pursuing such a seemingly imprudent policy path? Well, according to the Bank, they are performing active QT now so that there is room on the balance sheet for us to do more QE in the future…
According to an update in July from the Bank’s Deputy Governor of Banking and Markets, the reason for accelerating balance sheet shrinkage through sales is to provide room for “future balance sheet expansion” (i.e. QE) “if successive policy cycles meet the effective lower bound on interest rates” (i.e. if interest rates approach 0% again).
So, secondary market sales are not about fighting inflation now, but are a form of insurance policy to fight deflation later through QE. Forget about the cost of living now, says the Bank, worry about future deflation.
Undoubtedly, there are many reasons to fear deflation. The danger of deflation should not be understated, but inflationary spirals today scare me more than deflationary spirals tomorrow. Perhaps inflationary spirals seem less likely now than they did a year go, you might argue? In any case, I am of the opinion that in an increasingly de-globalised world, inflation will remain above the target 2% and we will not return to deflationary levels for many years to come. If you so desire, you can enjoy my full thoughts on inflation here:
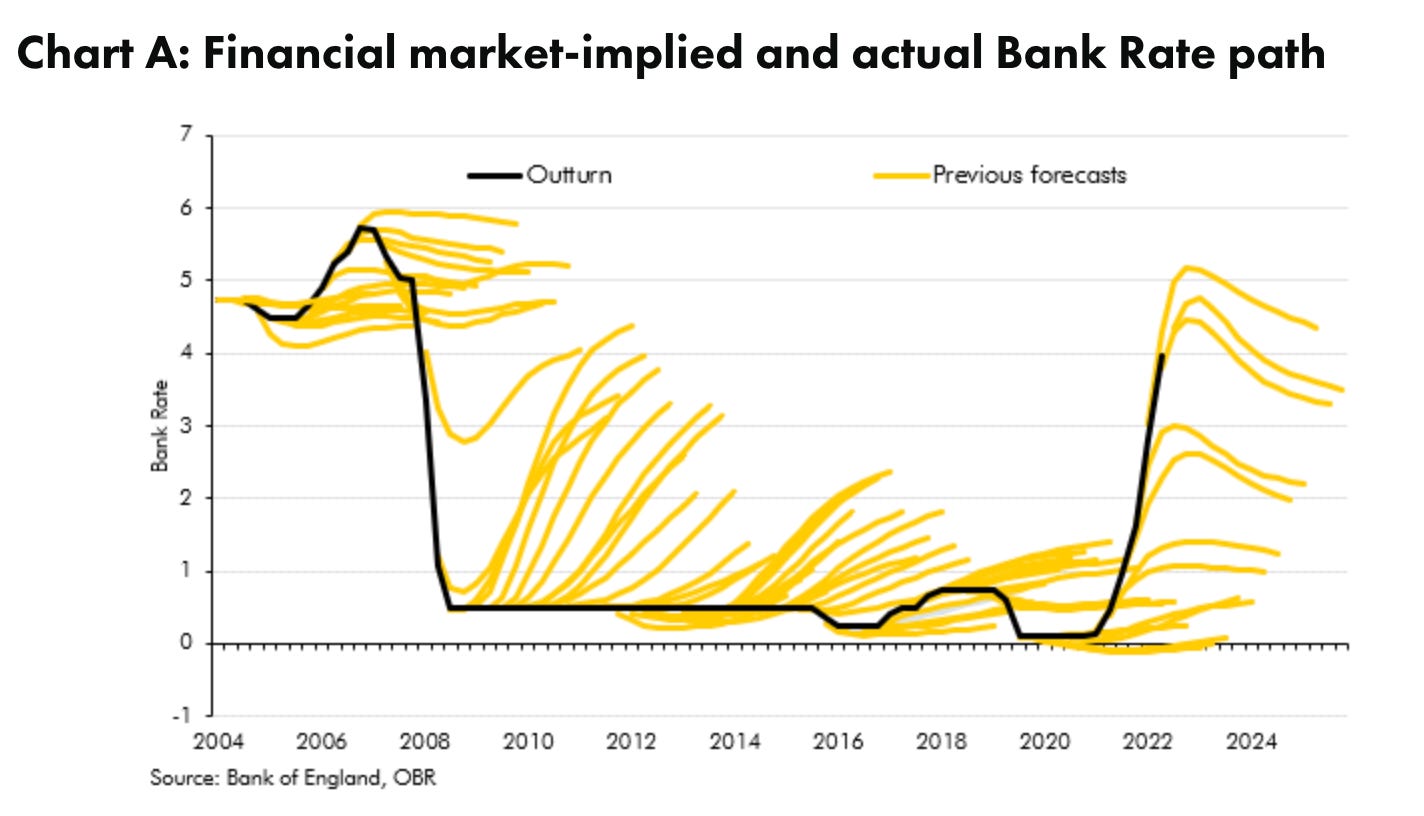
The Bank of England and even the bond market might disagree with me on the future path of inflation, but neither has a particularly stellar track record, as suggested by the charts below:
Note, this is a 2015 report, although I suspect that it looks worse now. Source: Bank of England
So the stated purpose of QT, according to the Bank, is that it speeds up balance sheet shrinkage. But such shrinkage is not necessary for today’s policy stance of monetary tightening, we have the Base Rate for that. The MPC themselves admit this:
The Monetary Policy Committee has a preference to use Bank Rate as its active policy tool when adjusting the stance of monetary policy. … QT should be thought of as operating in the background. [my emphasis]
Again, in my humble opinion, this is stunningly daft! QT is not some sleepy, meaningless background operation. It means flooding the secondary gilt market with liquidity. QT is very much active.
Volatility of gilt liquidity conditions. Source: Bank of England
What is more, all this liquidity comes at a time when the Treasury still needs to borrow substantial sums to halt the rise of taxes, cap energy prices for households and businesses, and increase defence spending. Most of the extra borrowing will be financed by issuing new British government securities at a time when the Bank of England is selling the stock of fixed-interest gilts back into the market, further increasing the cost of borrowing for the UK. RBC’s renowned Banks analyst Cathal Kennedy brilliantly illustrates the impact of quantitative tightening on UK net gilt issuance in the below pairs of charts.
On QT, to summarise, I suspect that this policy error will result in an unnecessary cost burden incumbent upon every single UK taxpayer.
In holding this opinion, I am not alone. This impact of this policy is relatively well reported across the media. So, perhaps I am not the only one worrying about this in the corner at the house-party.
The author at a house-party. Source: Author
For now, the Bank’s programme of QT continues.
What’s the damage, then? Assessing the losses from QE and QT
How should we assess the losses caused to the taxpayer by QE and QT? We could split them into the following categories:
Interest losses: Higher interest costs on short-term debt (QE);
Par value losses: Realised losses from secondary market gilt sales (QT).
It is important to note that, somewhat unrelated to QE and QT, we have also suffered from the fact that, despite significant new fixed issuance and refinancing by the DMO, a large proportion of government debt remained in inflation-linked debt.)
In total, as of the end of February 2023 the Bank of England Asset Purchase Facility has made a loss of £169.1 billion (about 6.5% of GDP). The reason that the Treasury has to stump up this money for the BoE’s APF is due to the aforementioned Deed of Indemnity (for which, see Appendix 3).
It is also worth highlighting that this loss in the most recent year is offset has been offset somewhat by positive historical cashflows, which reflect the coupon payments that the Treasury owed on debt securities held by the APF as a result of QE. While gilt yields were low and interest rates were close to zero, the gilt portfolio owned by the APF was profitable. The peak of the cumulative total of the positive transfers from the APF to the Treasury was £123.8 billion in September 2022.
Now, however, the rise in interest rates and gilt yields since has reversed the direction of flows. In total, over its entire life up to the present date, the APF has now made a cumulative loss to the tune of £72.3 billion (about 2.8% of UK GDP in 2023).14
That’ll be about £270 billion, please, Guv’nor!
Sources: Bloomberg LLP for market rates as at 31 March 2023 via FT Adviser. Bank of England calculations for data in relation to APF cash flows.
Consider this chart published by the Bank of England. The blue bars show the historic profits using the scale on the left-hand axis; the purple line is the cumulative number to date with values shown on the right-hand axis; the other lines show the projected loss to the Treasury under various scenarios.
Using market yields at the end of June 2023, as the pink line shows, the total loss from QE will be £150 billion. From the peak inflow this is a total loss of more than £270 billion, or almost £10,000 for every household in the UK.
£270 billion! That figure is 3 times our annual education budget or 9 times the annual defence budget. These are real taxpayers costs. These are avoidable losses.
Let’s clarify that accusation of avoid-ability.
The losses on QE, resulted from the rise in interest costs (the mechanics of which we have now discussed at length).15 I think that it is reasonable to argue that QE was not strictly necessary to operate monetary policy effectively, so this predicament was, in my view, avoidable.16
Likewise, the losses on QT, still ongoing, result from gilt sales crystallising losses, and are entirely irrelevant to today’s monetary policy objectives. Therefore, this category of losses are totally avoidable and likely to be unnecessary as far as I am concerned.
The call to action
There is still time to stop further losses and shift the path of future APF cashflows.
The Bank could halt active quantitative tightening today and instead pursue a policy of unwinding prior phases of QE passively, by holding bonds to maturity.
Unless I hear a persuasive case to the contrary, this is the case that I will be making.
Is the level of UK government debt sustainable?
Messages on the side of large vehicles are always correct, right? Source: TaxPayers’ Alliance
Is the level of UK government debt sustainable?
As we have observed, UK public debt levels are at their highest in generations and the cost of servicing the debt is soaring.
This outlook seems grim and, in isolation, the level of debt and the recent rise in interest rates would imply that the government debt is on an unsustainable trajectory.
There is no such thing as borrowed money, just deferred taxation. It would be nothing short of immoral for today's politicians to simply hand over this eye-watering credit card bill to the next generation, and they must push on with spending reductions so that Britain might live within its means once again.
Jonathan Isaby, Chief Executive of the TaxPayers' Alliance, June 2015
The government has too much debt, our deficits are too large, and this is all going to end in ruin through a massive debt default. Arguments to that effect have been the rallying cry of fiscal conservatives for decades, or centuries, or perhaps even millenia.
As you can probably tell by now, I have a lot of sympathy for this rallying cry, (less in the vein of TaxPayers’ Alliance, more aligned to Joachim Klement’s approach - a piece of his writing is the source of inspiration for the following paragraphs).
Having more government debt means the cost of servicing this debt increases. That, in turn, means that there is less money available for government for investments, education, defence and so on. The lack of investment is ultimately then detrimental to GDP growth.
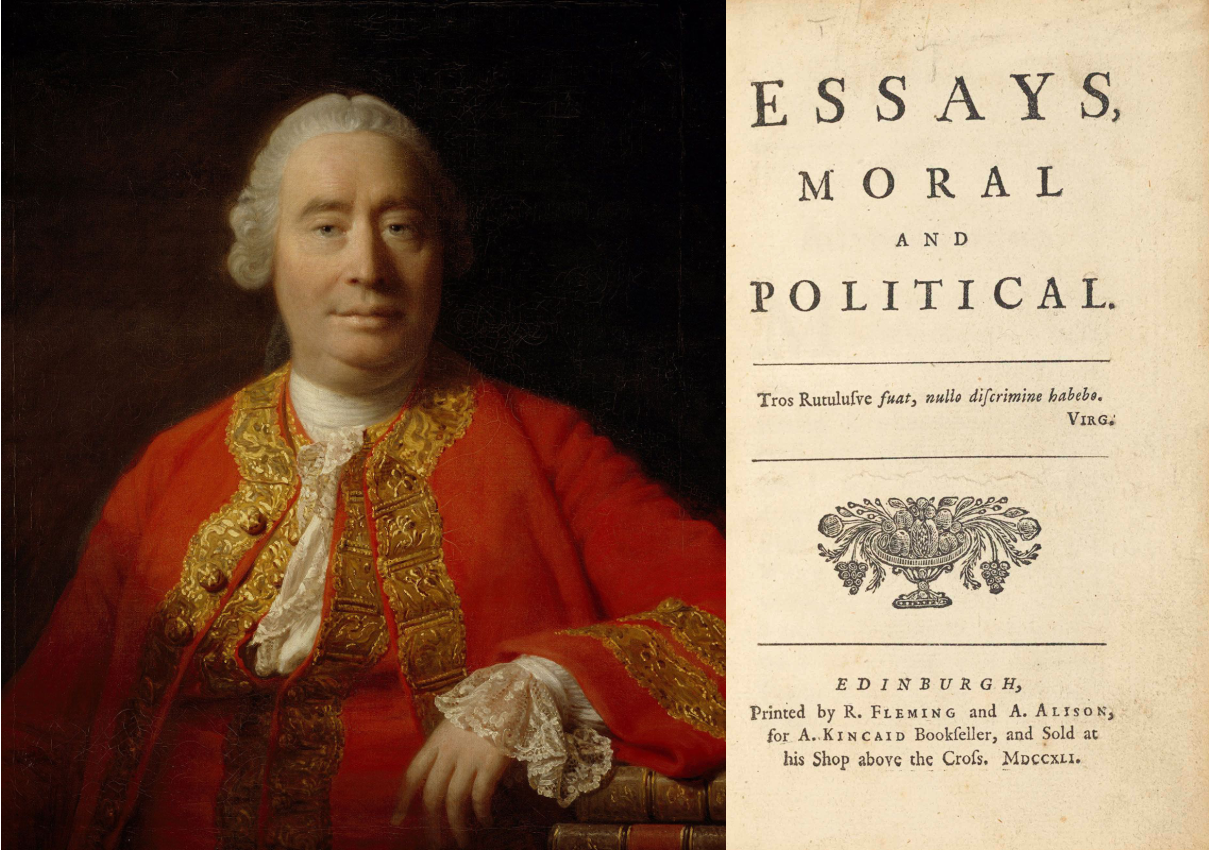
Some time ago, there was an Englishman who reached that same conclusion. Based on similar conditions to these, he surmised that the government would have to either raise taxes to pay for all that debt at once or default when the debt became too large to service.
That man was David Hume, the scion of the Scottish Enlightenment, and he reached that conclusion in 1764.
It has been 260 years since Hume shared his forecast and the debt of the UK government has grown exponentially since, well beyond anything he or anyone else at the time could have imagined. Yet, the UK still remains one of the very few countries in the world that has never defaulted on its debt, never experienced hyperinflation, and sterling remains one of the most important and most traded currencies in the world.
Hume’s forecast has been wrong for 9 generations. Will it endure another generation?17
Some would say that what cannot happen will not happen - a British default would be unconscionably disastrous. Others would maintain that there is a limit to debt levels.
Our modern expedient, which has become very general, is to mortgage the public revenues, and to trust that posterity will pay off the incumbrances contracted by their ancestors.
…
I must confess, that there is a strange supineness, from long custom, creeped into all ranks of men, with regard to public debts. So great dupes are the generality of mankind, that, notwithstanding such a violent shock to public credit, as a voluntary bankruptcy in England would occasion, it would not probably be long ere credit would again revive in as flourishing a condition as before.
Here is a more optimistic vision. There are two other important factors that can affect debt sustainability that may offer more sustainable paths for the public debt burden:
GDP growth;
Inflation.
The rate of growth in GDP matters for debt sustainability. If your economy is booming, you can effectively grow your way out of debt. Amid increased output and government revenues, GDP growth incrementally lowers the debt-to-GDP ratio as the denominator expands. The OBR’s outlook for UK GDP growth is middling, but we do not know what the future may hold. A technological optimist might bet on the development of new innovations that could grow us out of our debt.
Likewise, although high inflation is generally not considered a good thing, there is one non-obvious potential benefit; namely, higher inflation erodes the real value of the public debt (not the nominal amount).
Whether this inflation is good or not for the public debt depends on whether your income increases in-line with the inflation. Assuming your tax receipts continue to grow in-line with inflation, then the relative size of your public debt shrinks, since you still owe the same amount of money but you earn more in relative terms, so your debt as a percentage of your income is lower. In absolute terms, the debt number stays the same, but in real terms, it has diminished relative to national income.
For those of us that argue that quantitative easing is inflationary, this is admittedly one unexpected positive.
International peer group comparison
A slightly less optimistic vision is offered when one makes an international comparison to see how the UK’s public finances compare to those of other developed countries. To this end, we can look at the data for 42 industrial countries produced by the Organisation for Economic Cooperation and Development (OECD).
The chart below is lifted from the OBR’s quarterly fiscal update. It illustrates how the UK, highlighted in the blue bars, raises slightly less revenue relative to national income than the majority of other industrial countries – more than the US, Japan and Korea, but less than Scandinavian countries like Denmark and Norway. Public spending as a share of national income in the UK is slightly above the average of other industrial countries – the UK spends much more than Japan and Korea, but much less than Finland or France. Spending just above the international average, but raising less in revenue, leaves the UK running a budget deficit that’s far above the industrial world average. Net debt in the UK is also higher than the average of other industrial countries.
So, at best the UK is middle of the pack. A less generous observer might surmise that the UK more indebted and less well-funded than most peers.
Worst case scenarios & defaults
This is the OBR’s assessment of where we stand:
In a benign scenario where the increase in interest rates reflects higher economic growth, the debt stock could ultimately be lower and the primary balance more favourable, all resulting in a virtuous fiscal circle.
But malign scenarios are possible too. If interest rates rise because investors demand a higher risk premium for some reason, this would be more likely to be accompanied by a deteriorating economic and fiscal position, resulting in a vicious fiscal circle. In such circumstances, governments can find it difficult to make the spending cuts and tax rises necessary to restore the debt trajectory to a sustainable path.
So, what could happen in one of these worst-case scenarios where public debt turns out to be unsustainable?19
This is where my imagination may be found to be lacking. My knowledge of sovereign defaults is limited, so it is quite possible that there are far more alternatives available than the ones that I describe here. I would be very interested to hear readers’ views on ways in which future policymakers might seek to deal with unsustainable debt levels.
Here, in brief, are several scenarios that I can envisage:
Financial repression (increase in funding sources): Financial repression occurs when governments implement policies to channel to themselves funds that in a deregulated market environment would go elsewhere. Toby Nangle eloquently describes it as: “Meddling around to artificially depress real interest rates.” This, in large part, is how the national debt was slashed after World War II, during which time the interest rate on government debt was also lower than the inflation rate in 24 of the 30 years, notably when inflation was particularly high. Specific policies that enable this include directed lending to the government by captive domestic audiences (such as pension funds or domestic banks), explicit or implicit caps on interest rates, higher reserve requirements (or liquidity requirements), securities transaction taxes, prohibition of gold purchases, or the placement of significant amounts of government debt that is non-marketable.20
Drastic austerity measures (public spending cuts): Given that so many cuts have already been made to public spending in the UK over the last decade, there is little low-hanging fruit left in this austerity category. That means that it would take drastic changes, for example, a complete overhaul of the funding model of the National Healthcare Service and forms of social security, to make the necessary scale of public spending reduction that would be required.
Drastic taxation measures (revenue raising): The government takes drastic measures to discharge public debt by selling off infrastructure and other remaining state property, seeks to raise revenues through extreme forms of taxation, or takes actions to requisition the assets of their citizens and corporations. For more drastic tax proposals, consider the retroactive, one-off wealth taxes recently proposed by the UK Wealth Tax Commission. For historical comparisons for property seizures and asset sales to fund public finances, recall how, in the 16th century, Henry VIII dissolved monasteries in England and disposed of their property to fund his military campaigns. Likewise, during the French Revolution, the Constituent Assembly confiscated the clergy’s estates and auctioned them off to wipe out the public debt.
Technical default (amend & extend/distressed exchange): Arranging a restructuring of outstanding debts is another way to manage sovereign debt. Sovereign debt restructuring is complex, involving the national government, international creditors, and various third parties. Creditors might agree to receive new securities in kind to avoid a full default, accept missed interest payments, or voluntarily waive their redemption rights or other contractual obligations that they are due. Another popular debt-alleviating protocol is to amend and extend the maturity date of debts further into the future. For instance, to allay the burden on the public purse, governments could reschedule debt payments over several decades, converting 30-year Treasury bonds into even longer-term instruments. Depending on the maturity of the loans, public debt could become more or less perpetual. In exchange, creditors may demand more generous returns.
Full default: In a particularly extreme scenario, the sovereign could simply fail or refuse to pay back its debt in full when due. Even today, this is a relatively common occurrence amongst so-called ‘emerging market’ sovereign issuers. A full default has serious economic consequences for a nation, typically making it significantly more expensive or sometimes impossible for the sovereign to borrow money in the future. Mozambique, Lebanon, Ecuador, Sri Lanka, Suriname, Belize, Russia, Ukraine, and Zambia have all defaulted or restructured their debts in the past few years.
Debt cancellation: As my colleague writes in the FT,
In a world where a lot of sovereign debt is being bought by central banks, intrinsically, all we are doing is allowing the left hand of the government to owe the right hand of the government a lot of money. At some point they could just shake hands and throw the debt away.
Debt forgiveness has not occurred in Western Europe since the aftermath of World War II, but is a feature of global sovereign debt restructuring processes. Since central banks have become their countries’ major creditors through quantitative easing programmes, the prospect of debt forgiveness is less remote than it has been in the recent past. That said, in 2020, when senior Italian officials asked the European Central Bank to ease debt burdens by forgiving Italian sovereign bonds that the ECB owned, the proposal was quickly dismissed by Christine Lagarde and other policymakers. Might there be ways around this? For example, consider what would happen if governments issued 10,000 year bonds at an interest rate of zero and the central banks then bought them up. That is effectively doing the same thing as cancelling the debt.
Closing thoughts
Here, I will draw this post to its conclusion.
Over the course of this indefensibly long piece of writing, I hope that I have been able to offer reasonable answers to some of the questions that we posed at the outset:
How does the UK government raise revenues? Through taxation and other receipts.
How does the UK government spend public money? Mostly on social security, health, and debt interest costs.
How does the UK raise capital? Through the sale of government debt.
Why have UK government debt interest costs soared? As a result of our public debt’s exposure to interest rates due to quantitative easing and inflation-linked gilts.
Is the level of UK government debt sustainable? Hopefully, but there is an increasing likelihood that a malign scenario could arise. Some say what cannot happen will not happen, but we should not exclude the non-zero probability of a UK government debt default.
Two very clear, objective takeaways for me from this research are:
Our public debt is increasing more rapidly than before; and,
The cost of public debt has reset dramatically higher.
This is true across the world, with many countries registering debt levels at peacetime highs, across both emerging and developing markets.
One final, more subjective, takeaway for me is:
Active quantitative tightening is a serious policy error that should be halted immediately and replaced with a policy of passive quantitative tightening.
The state of our public finances matters to each and every one of us. Whether we realise it or not, our ability to spend and invest in public services, in each other, and in our futures will govern the course of all of our lives.
In that same article, my colleague concludes by saying:
Forcing future generations to pay back the debt we are taking on now will become increasingly untenable at a time when populations are ageing and the number of individuals in work is diminishing. It will also create huge pressure within society and greater divisions between old and young, risking a real of loss of social cohesion.
I cannot help but hear the echoes of Hume there: “Posterity will pay off the incumbrances contracted by their ancestors.” Is this just another false prophecy, or a proportionate warning?
Fixed income managers are famously some of the most measured people (some would say most boring) in all of finance. That passage above was penned by the Chief Investment Officer of a leading fixed income manager warning us, in a national paper, that levels of debt are dangerously high.
When the most boring man in the room says that debt cancellation should be an option in the monetary policy toolkit, I sit up in my chair and listen. Although I do not necessarily agree that debt cancellation is the most appropriate solution, I do agree that debt sustainability and measures to resolve it should be taken seriously by policymakers. In short, Hume could yet be proved correct.
In any case, I doubt that this will be the last that we will hear of the public finances and debt interest costs in the coming months and years.
Thanks for reading Suburban Mantuan! Subscribe for free to receive new posts.
Thank you for reading and making it all the way to the end. As always, please reply if you have comments, questions or suggestions. Doubtless, I will have made many serious errors or overlooked key counter-arguments in writing this piece.
Please do not hesitate to reach out and I look forward to hearing from any of you that want to discuss this further.
Appendix 1: Independent fiscal bodies for UK public finances
The primary subjects of the analysis conducted by independent fiscal bodies include:
His Majesty's Treasury, occasionally referred to as the Exchequer, or more informally the Treasury, is a department of His Majesty's Government responsible for setting public spending and developing and delivering UK economic policy.
HM Revenue & Customs (HMRC), the government body that enforces and administrates the collection of these various taxes and revenues.
Office for National Statistics (ONS)
The Office for National Statistics (ONS) is the UK's largest independent producer of official statistics and its recognised national statistical institute.
The ONS is responsible for collecting and publishing statistics related to the economy, population and society at national, regional and local levels.
The OBR produces detailed five-year forecasts for the economy and public finances twice a year. The forecasts accompany the Budget Statement (usually in late November) and the Spring Statement (usually in March). They incorporate the impact of any tax and spending measures announced in those statements by the Chancellor.
The NAO supports Parliament in holding government to account and improving public services through high-quality audits. The NAO audits and reports on the financial accounts of all government departments and other public bodies as well as examining and reporting on the value for money of how public money has been spent.
Institute for Fiscal Studies (IFS)
The Institute for Fiscal Studies (IFS) is an independent research institute with the principal aim of better informing public debate on economics in order to promote the development of effective policy.
The IFS Tax Lab aims to provide better access to impartial information about how the UK tax system works, the effects it has on different people and businesses, and the options for reform. Everything on the site is either a verifiable fact or a conclusion drawing on the best possible evidence.
(H/t this section to Stefan Collini and Paul Johnson, whose recent book, ‘Follow the Money’ I am currently digesting and enjoying.)
From the beginnings of a bureaucratic ‘fiscal state’ in Britain in the late 17th and 18th centuries, customs and excise were the chief sources of public revenue.
From time to time, clumsy attempts were made to tax wealth using some easily identifiable metric, as in the window tax or hearth tax or the tax on the number of male servants: each eventually succumbed to criticism and opposition. What helped to at least partly legitimate customs and excise duties was the fact that, unlike in France, there were no special exemptions for a particular class or social category. As a result, the historian John Brewer has noted, although ‘there were occasional attacks on revenue officers, these were usually carried out by professional smugglers rather than by outraged taxpayers.’ But grumbling acquiescence (the most any fiscal system can usually expect) to customs and excise went along with fierce hostility to any form of direct taxation.
When the younger Pitt first introduced a form of income tax in 1799 as an emergency measure to help pay for the war with revolutionary France, it certainly did not meet with universal acceptance. ‘The income tax,’ thundered the radical MP Francis Burdett,
has created an inquisitorial power of the most partial, offensive and cruel nature. The whole transactions of a life may be inquired into, family affairs laid open, and an Englishman, like a culprit, summoned to attend commissioners, compelled to wait like a lacquey in their anti-chamber [sic] from day to day until they are ready to institute their inquisition into his property; put to his oath, after all perhaps disbelieved, surcharged and stigmatised as perjured, without any redress from or appeal to a jury of his country ... Sir, the repeal of this tax is not a sufficient remedy for its infamy; its principle must be stigmatised and branded.
Despite such denunciations, the state’s need for revenue during the Napoleonic Wars kept the tax in place; it was abolished only after victory at Waterloo.
Income tax was reintroduced in the early 1840s by the Tory prime minister Robert Peel, who argued that a modest levy would actually help protect property from more severe despoliation in difficult times. Once the danger was past, it could be repealed, as Peel proposed to do after three years. Of course, all times can feel like difficult times and the tax was not repealed. Ultimately it was the Liberal chancellor (and subsequently prime minister) Gladstone, more than any other individual, who secured the position of income tax as a fundamental and accepted part of the public revenue, though he insisted that it must remain a flat-rate tax. Graduation, he argued, was
generally destructive in its operation to the whole principle of property, to the principle of accumulation, and through that principle, to industry itself, and therefore to the interests of both poor and rich ... It means merely universal war, a universal scramble among all classes, everyone endeavouring to relieve himself at the expense of his neighbour, and an end being put to all social peace, and to any common principle on which the burdens of the State can be adjusted.
Gladstone may have believed that a graduated income tax was corrosive of accepted notions of private property, but before long the argument went a different way: the feeling grew that a flat tax was so out of kilter with people’s ideas of fairness that not to introduce some form of graduation would undermine the legitimacy of the system.
Appendix 3: The Deed of Indemnity
Different central banks have different arrangements for sharing both past QE & QT-related profits and future losses with their national treasuries and will account for these losses in a variety of ways and over different time periods. But, ultimately, the losses will end up on the books of their national governments who are the banks’ beneficial owners.
In the UK, where we are used to accounting for the whole public sector including the central bank, both past profits and current and future losses feed into our forecasts for public borrowing and debt as they crystallise.21
Cash-flow arrangements between the APF and HM Treasury: In line with the indemnification of the APF by HMT, the assets held in the APF generate a range of cash flows which – alongside interest costs and the gains or losses made at maturity or sale – drive consequent cash transfers between HMT and the APF. Transfers were agreed to be done on a quarterly basis. When this arrangement was put in place it was recognised that reverse payments from HMT to the APF were likely to be needed in the future as Bank Rate increased and as the APF's gilt holdings were eventually unwound by the MPC. The first such reverse transfer from HMT to the APF occurred in October 2022 and the second took place in January 2023.
Governor of the Bank of England: The previous arrangement was for these cash flows to accumulate on the APF's balance sheet. Because the APF is indemnified by the Government, any gains or losses it makes are ultimately due to the Exchequer. So the gilt coupons received by the APF amount to payments from one part of the public sector to another. As the scale and likely duration of the APF has increased significantly since its inception, I agree that it now makes sense to normalise the cash management arrangements for the APF.
Mervyn King, the Governor of the Bank of England, writing to the Chancellor of the Exchequer, George Osborne, November 2012
Perceptions of fiscal dominance: Fiscal dominance arises when there is a perception that the central bank balance sheet is being used to finance the government in a way that is not compatible with the inflation remit. There are a number of institutional safeguards against the risk that government financing considerations in the UK have an undue influence on monetary policy. However, even an incorrect perception of fiscal dominance can undermine a central bank’s reputation and credibility, and therefore threaten its ability to meet its inflation target.
Governor of the Bank of England: As you are aware, the Bank and HMT agreed in 2012 to transfer coupon payments received by the APF, net of interest costs and other expenses, to the Exchequer in order to facilitate more efficient cash management across the public sector as a whole.
It was recognised that this arrangement would result initially in pay ments from the APF to the Government, and indeed around £123bn of cash transfers were made from the APF to HMT between 2013 and September 2022. It was also recognised that it was likely that these cash flows would need to be reversed, with payments being made, on a timely basis, from the Government to the APF in order to meet the terms of the indemnity as Bank Rate rose and the APF’s holdings were unwound by the MPC.
Consistent with these arrangements, quarterly transfers from HMT to the APF have taken place: the first occurred in October 2022, and the second in January 2023
Andrew Bailey, the Governor of the Bank of England, writing to the Chancellor of the Exchequer, Jeremy Hunt, April 2023
Appendix 4: Notes on specific UK government revenue line items
Personal income taxation
Income Tax: Levied on most forms of personal income.
Each person has a personal allowance of income that can be received tax-free.
Only around 60% of adults have income high enough to pay income tax.
Above the personal allowance, income is split into bands that are taxed at different rates.
The personal allowance is gradually withdrawn from individuals with incomes over £100,000 a year, creating an effective 60% tax rate on incomes between £100,000 and £125,140. In a similar fashion, families receiving child benefit have it withdrawn when the highest-income parent’s income exceeds £50,000.
National Insurance Contribution (NIC): They are paid by employees and the self-employed on their earnings, and by employers on the earnings of those they employ.
The UK has two taxes on income. Though different in origin, income tax and National Insurance contributions (NICs) are now very similar.
The link between NICs and benefit entitlements is now vanishingly weak. Maintaining two separate taxes yields little benefit, but makes their combined effects less transparent and imposes extra administrative burdens.
Onshore corporation tax (CT) is levied on the taxable profits of limited companies and other organisations, after taking into account various deductions (for the costs of running the business) and allowances (for example capital allowances for investment spending). The headline rate of onshore CT in 2023-24 is 25 per cent.
My interest in this subject was stirred further by an article that one of my colleagues published in the FT in 2021 arguing for debt cancellation as a solution to elevated debt levels.
Source, OBR. This specific measure of national income is termed ‘public sector current receipts’ in the ONS official statistics. The methodology for the calculation of this figure is devastatingly complex and the figure has to be derived from a vast network of sources. Full methodological details here.
I intend to return to the conceptualisation of large figures in a forthcoming piece (will link it here once complete). GDP is another methodologically complex measurement which merits further discussion, not least because it is widely-recognised as being deeply imperfect, albeit heuristically useful.
In May 2022 Mr Sunak announced additional support for households for the rising cost of living, with increases in payments to households worth a total of £15 billion. This energy package also included a new temporary energy profits levy, widely dubbed a windfall tax. At the time, the Treasury said that this ‘will raise around £5 billion over the next year’. However, with energy prices subsequently rising substantially, the estimated yield has also increased: the latest Treasury estimate is that this measure will now raise £7.7 billion in 2022–23 and a total of £28 billion over the four years from 2022–23 to 2025–26 (HM Treasury, 2022b). IFS
Forecast years (in blue) from 2022-23 are consistent with the OBR Economic and fiscal outlook forecast published November 2022. Source: ONS and Bank of England Calculations. The historical GDP and debt data are taken from the Bank of England’s “The UK recession in context – what do three centuries of data tell us?” article from the Quarterly Bulletin Q4 2010. Numerator (£ PSCR, £ TME, £ PSNB, £ PSND) 1900-01 to 1945-46 (1973-74 for PSND): Updated 19 June 2020 to reflect Bank of England's A millennium of macroeconomic data Version 3.1 dataset. 1946-47 (1974-75 for PSND) to 2021-22: Updated 21 October 2022 to reflect the latest available ONS data. 2022-23 onwards: Updated 17 November 2022 to reflect OBR November 2022 Economic and fiscal outlook. Denominator (Nominal GDP Financial year/Centred End-March) 1900-01 to 1947-48: Updated 19 June 2020 to reflect Bank of England's A millennium of macroeconomic data Version 3.1 dataset. 1948-49 to 2021-22: Updated 21 October 2022 to reflect the latest available ONS data. 2022-23 onwards: Updated 17 November 2022 to reflect OBR November 2022 Economic and fiscal outlook. Interpolated data 1975-1984.
Net borrowing – often described as the deficit – is the difference between what the government spends and what it receives in taxes over a particular time period. Net debt is the total amount that the public sector owes – it is largely the stock of past borrowing. All figures used here exclude public sector banks.
House of Commons: HMRC has published its own estimates of the amount of fraud and error in the Covid-19 schemes that it oversaw: the Coronavirus Job Retention Scheme (CJRS), the Self-Employment Income Support Scheme (SEISS), and Eat Out to Help Out. These suggest that in 2020/21 and 2021/22, fraud and error in these schemes has cost the government around £5.1 billion. However, as the chart below shows, there is considerable uncertainty in this estimate; for example, HMRC estimate the level of fraud and error in the CJRS as being between £2.0 billion and £5.5 billion, although they think the most likely figure is £3.5 billion.
The accounting principles behind cash management for the Bank of England and the Asset Purchase Facility were established by the Deed of Indemnity, discussed in Appendix 3.
Modern monetary theory (MMT), whose advocates I have denigrated, argues that a sovereign nation with its own fiat currency, its public debt denominated in its own currency and a floating exchange rate cannot go broke. The only limit on public spending is inflation, and this is not a binding constraint for the U.S. In some versions of the MMT, the price level is set by the government.
MMT rose to prominence in the late 2010s because it seemed to “explain” some of the key events in the post-crisis era, including the persistence of zero interest rates and very low global inflation. It also provided a convenient justification for those on the political left who favour a large fiscal expansion in order to finance climate policies, universal healthcare and a public sector job guarantee for unemployed workers. Further reading:
Changes in Bank Rate are particularly important for the path of APF cash flows. First, Bank Rate affects the interest payment the APF must make on its loan from the Bank – a rising Bank Rate means there is a smaller (or, indeed, negative) surplus of income once interest on the Bank of England loan is paid. Second, Bank Rate affects the level of the yield curve which will have an impact on the price received when gilts are sold from the APF to the private sector.
To summarise once more, QE effectively shifted a large fraction of UK government debt from fixed-rate borrowing (where debt-servicing costs are ‘locked in’) to floating-rate borrowing (where debt-servicing costs rise and fall with Bank Rate). Increases in Bank Rate therefore lead immediately to higher debt-servicing costs for the government, leaving the British state with a large risk exposure to rising interest rates.
Admittedly, QE evangelists would disagree strongly here, and I suppose there is a case to be made that, when interest rates are so extraordinarily low, some novel form of monetary policy may need to be explored.
The whole text is fascinating. Another passage describes the early liquidity conditions of gilt trading:
Public securities are with us become a kind of money, and pass as readily at the current price as gold or silver. Wherever any profitable undertaking offers itself, how expensive soever, there are never wanting hands enow to embrace it; nor need a trader, who has sums in the public stocks, fear to launch out into the most extensive trade; since he is possessed of funds, which will answer the most sudden demand that can be made upon him. No merchant thinks it necessary to keep by him any considerable cash.
Economist Barry Eichengreen presented a paper on the topic of debt sustainability and the outlook for debt levels at this year’s Jackson Hole Economic Symposium, which was reportedly one of the most discussed topics at the conference. His discussion is far more informative than the notes that I offer in this piece and is worth a read:
Policies lifted from IMF piece, Financial Repression Redux, June 2011, Reinhart, Kirkegaard, and Sbrancia. In the post-World War II era, UK financial repression policies included: “the Bretton Woods system, which featured restrictive exchange rate controls and a fixed exchange rate. Quantity and price controls on domestic bank lending also encouraged domestic financial institutions to invest in government debt.” OBR
I've managed to reach the end and though it took a while, it was very impressive reading principally for exposing:
a) the massive public cost of paying variable (high) interest rate on bank reserves instead of fixed (low) interest rates on Gilts (QE).
b) the massive public cost of selling Gilts (QT) and realising capital losses, a cost made worse because selling is unnecessary.
I think the Govt or BoE should have:
a) loaded up on debt while it was available at 0% interest (or negative), and used that pile to redeem Gilts at par when interest rates rose. That refinancing would have saved massive amounts of interest.
b) paid 0% interest on those reserves created by QE Gilt purchases. That would have a) saved public money by avoiding massive interest payments to banks and b) encouraged banks to lower their deposits and savings interest rates, which would have encouraged consumer spending and asset managers to invest their money (received from Gilt sales) and both would have raised GDP.
c) used simple derivatives to manage its interest rate risk, i.e, swaps or even FRAs, i.e., pay fixed and receive floating, so synthetically creating fixed rate liabilities (the equivalent of Gilts).